TodogrowLED is a Spanish LED light manufacturer for indoor growing.
The main problem was having a wide range of products with small differences like the spectrum (the Kelvin measurement), the SOG and SCROG methods or the heat dissipation. We are used to understand the storage capacity of a smartphone or the downloading speed of the wi-fi, but for most of us the indoor growing parameters were mostly unknown.
Product infographics
Media created to make the product understable to potential clients
Growing very expensive seeds is a risky investment for amateurs, so we tried to give our clients the best specific advices for each product. In this case, the variable distances recommendations depending on the growing phase are very useful so the plants get the correct amount of light.
In fact, the correct way to set the height is to measure it with a luxometer, but since it is a quite expensive product we designed a simplified chart to give our clients some guidelines.
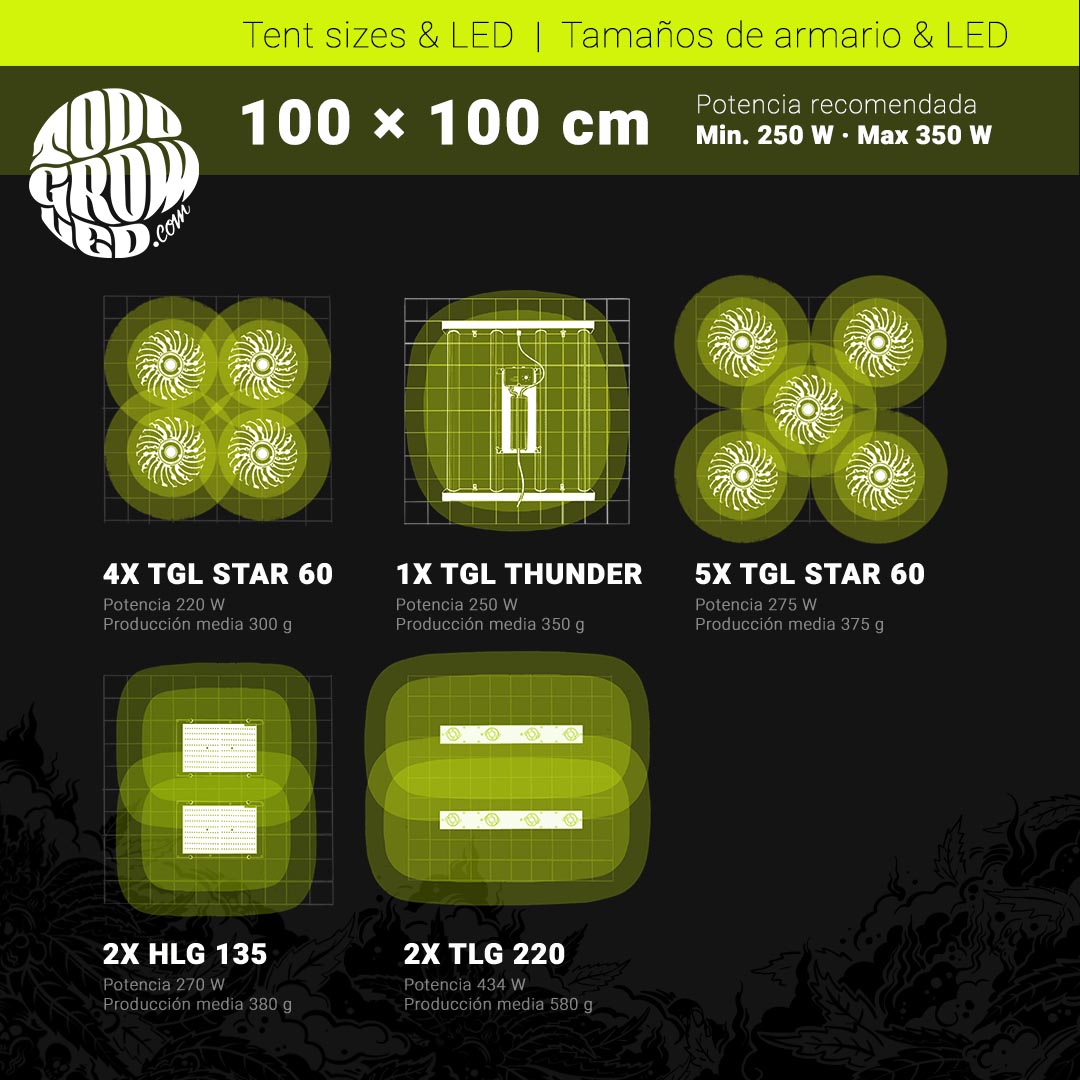
We also designed other assets like a simplified drawing of each light, so they could compare the aspect of them, the color spectrum and the recommended settings for each size of tent.


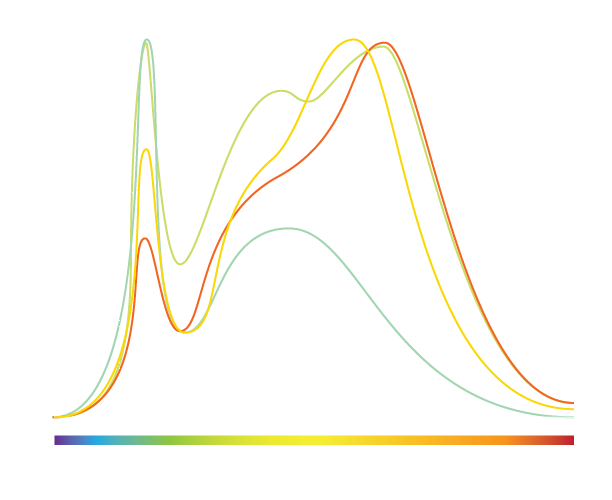

The color spectrum is very important in indoor growing and each one is useful (or not recommended) for a different kind of seed, growing method or growing phase.
Appart from the spectrum infographics in which we showed the type of light that each spectrum has, we also designed a chart where you can easily compare the spectrum in each multi-spectrum model. This way you can quickly see which one has the specific spectrum you are looking for.
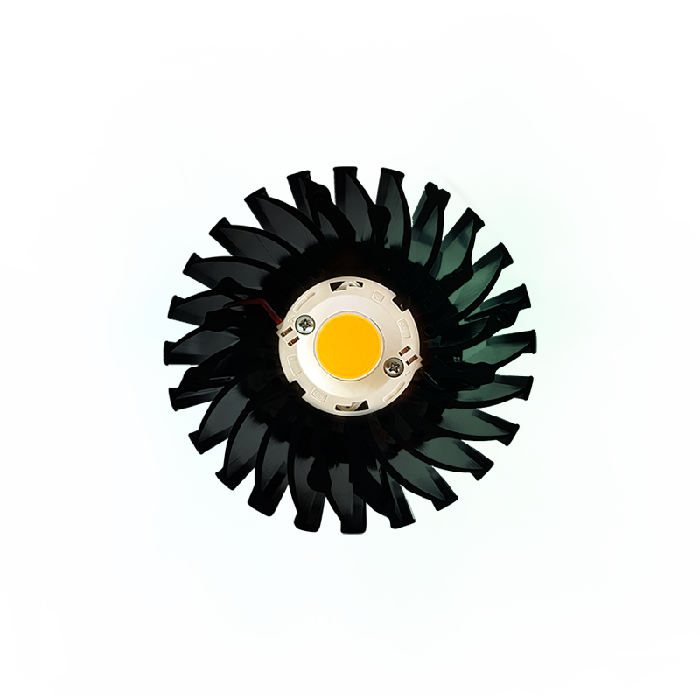
When choosing ths single-spectrum models it was not easier, so we created another chart which included photos and illustrations to identify the LED included in each model and the recommended use for the Kelvins given.
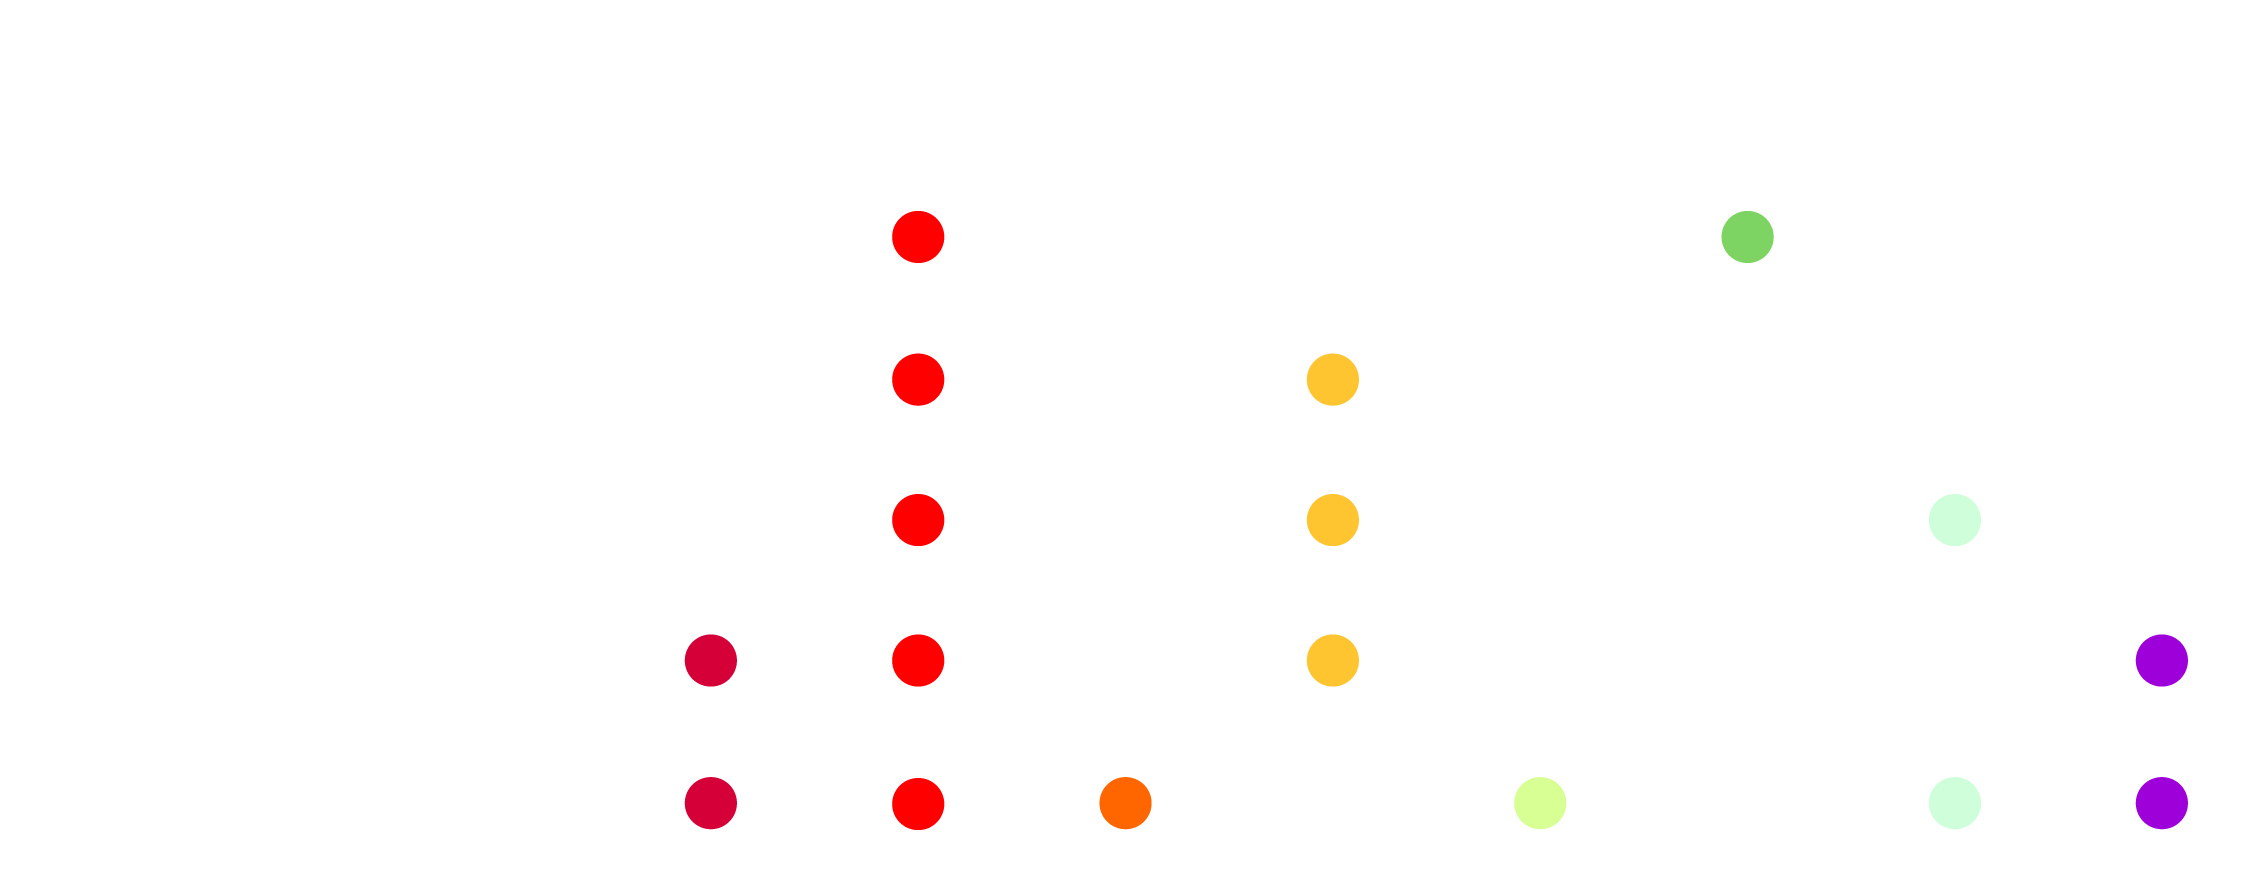
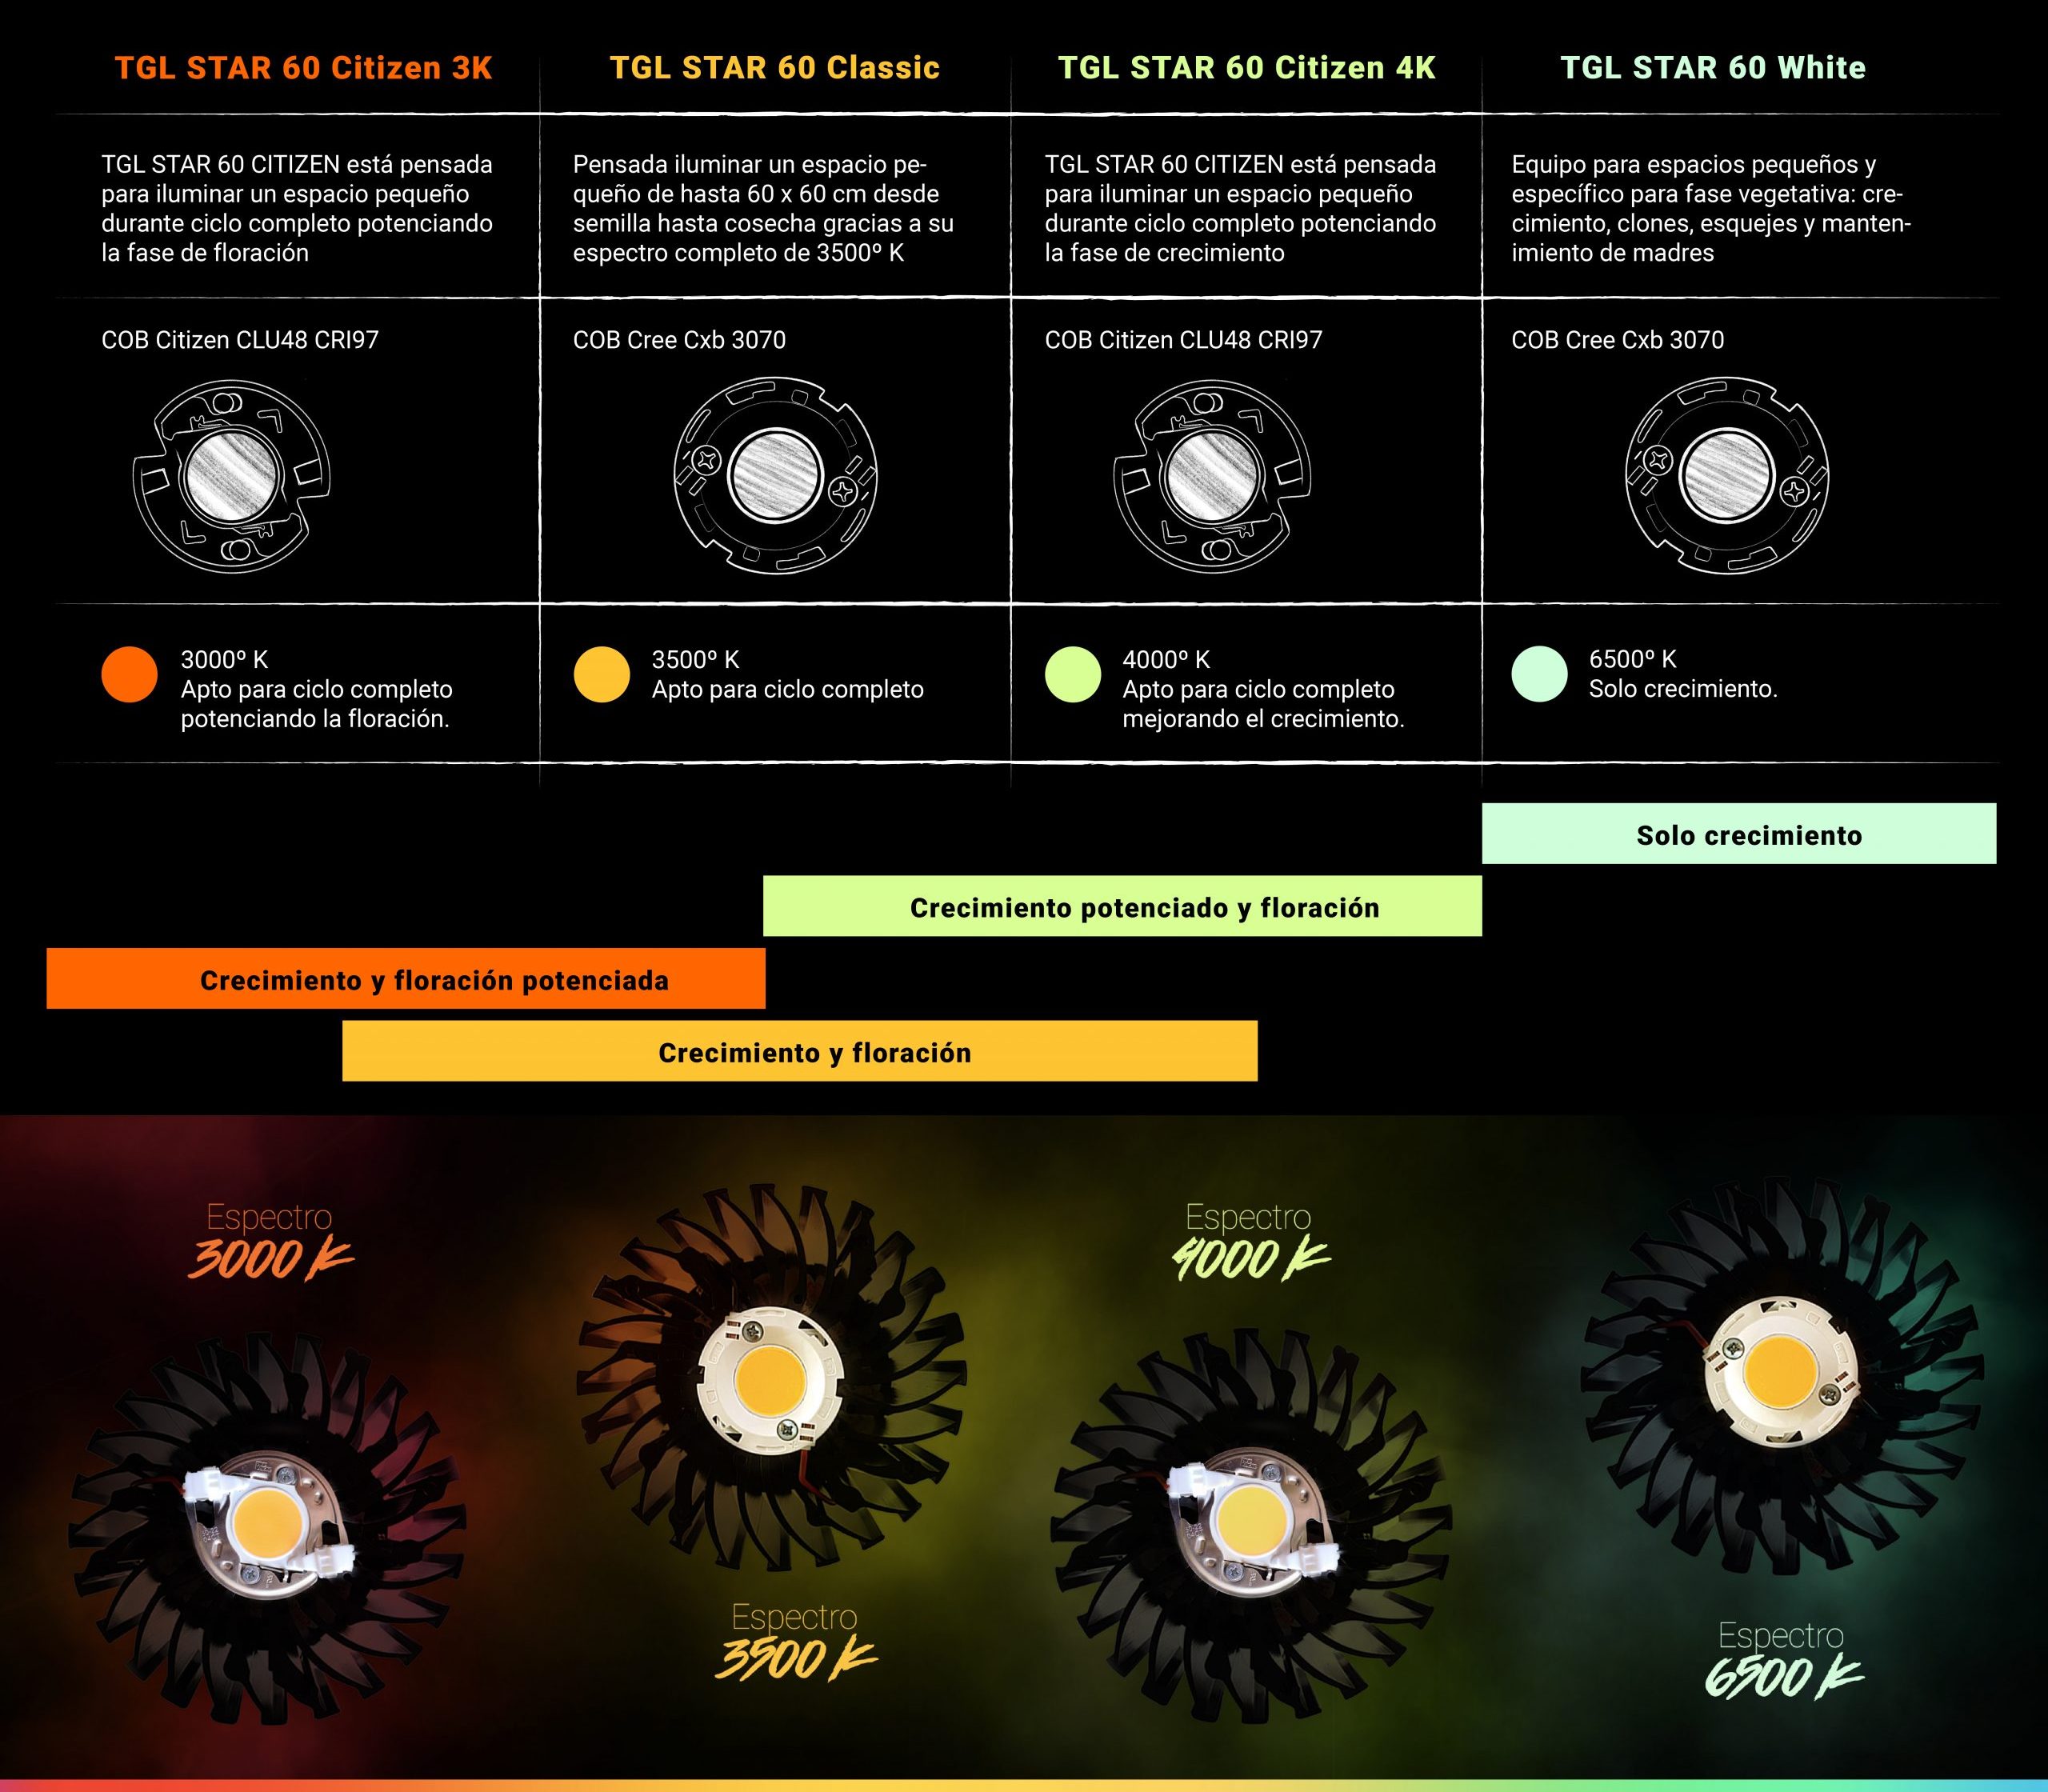
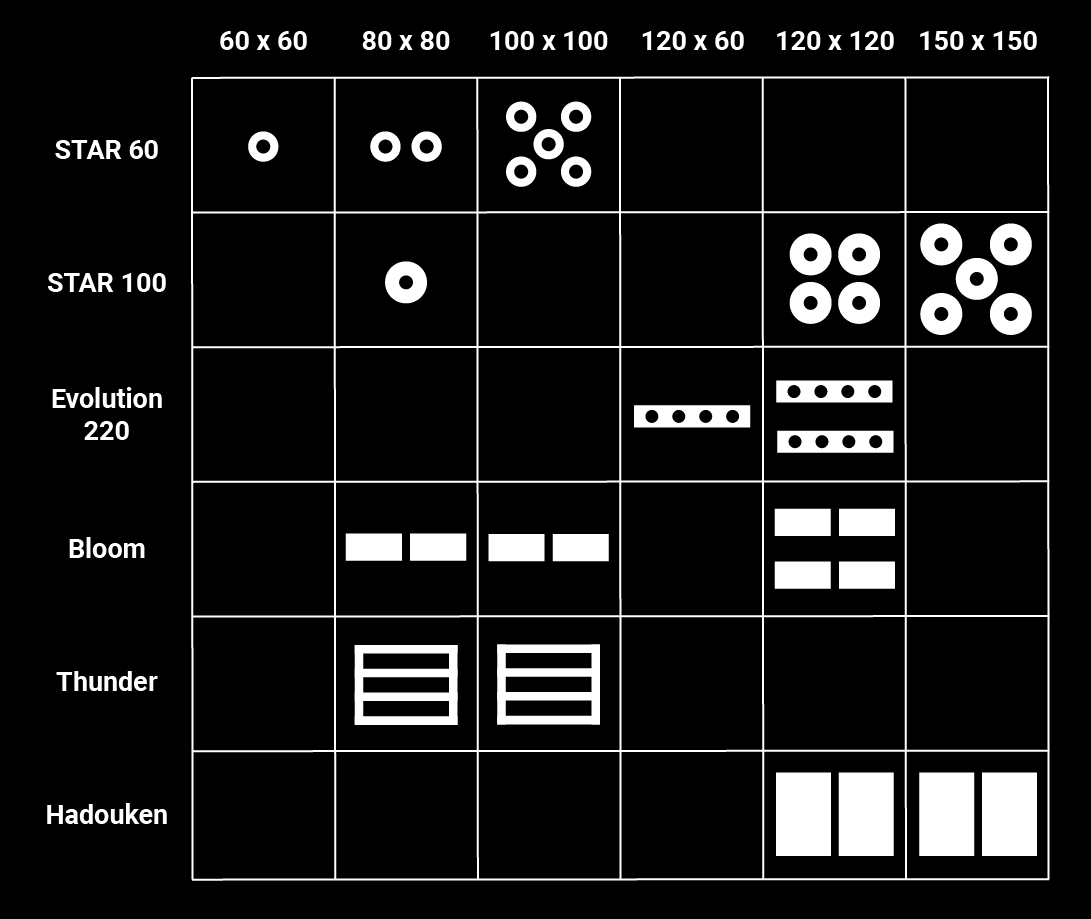
Due to the wide product catalogue and the very specific use for each one of the products, I designed many different infographics and tried many different ways to suggest a kind of product for the need of every client.
This one illustrates the recommendation for a previously owned/chosen area.
Instagram posts
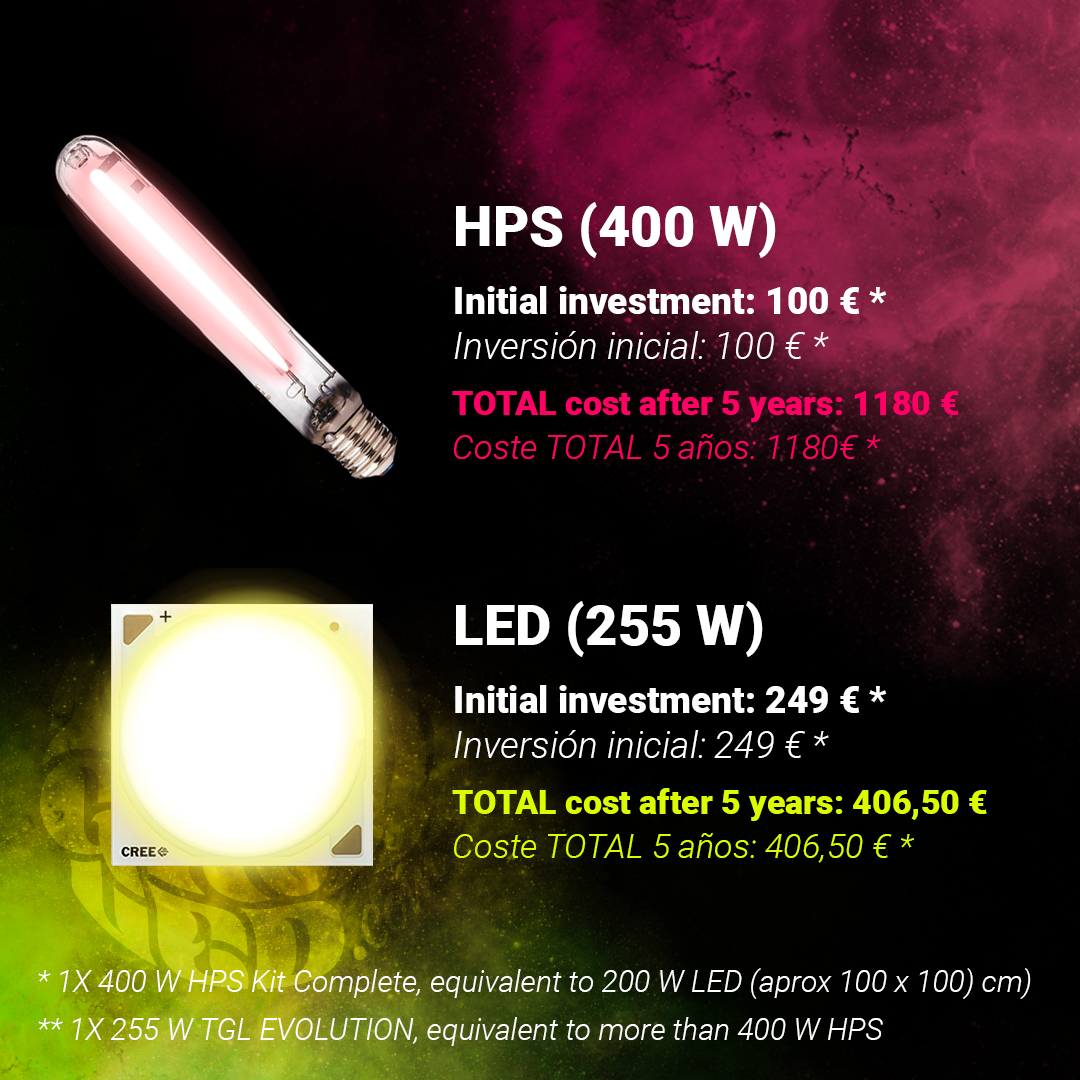
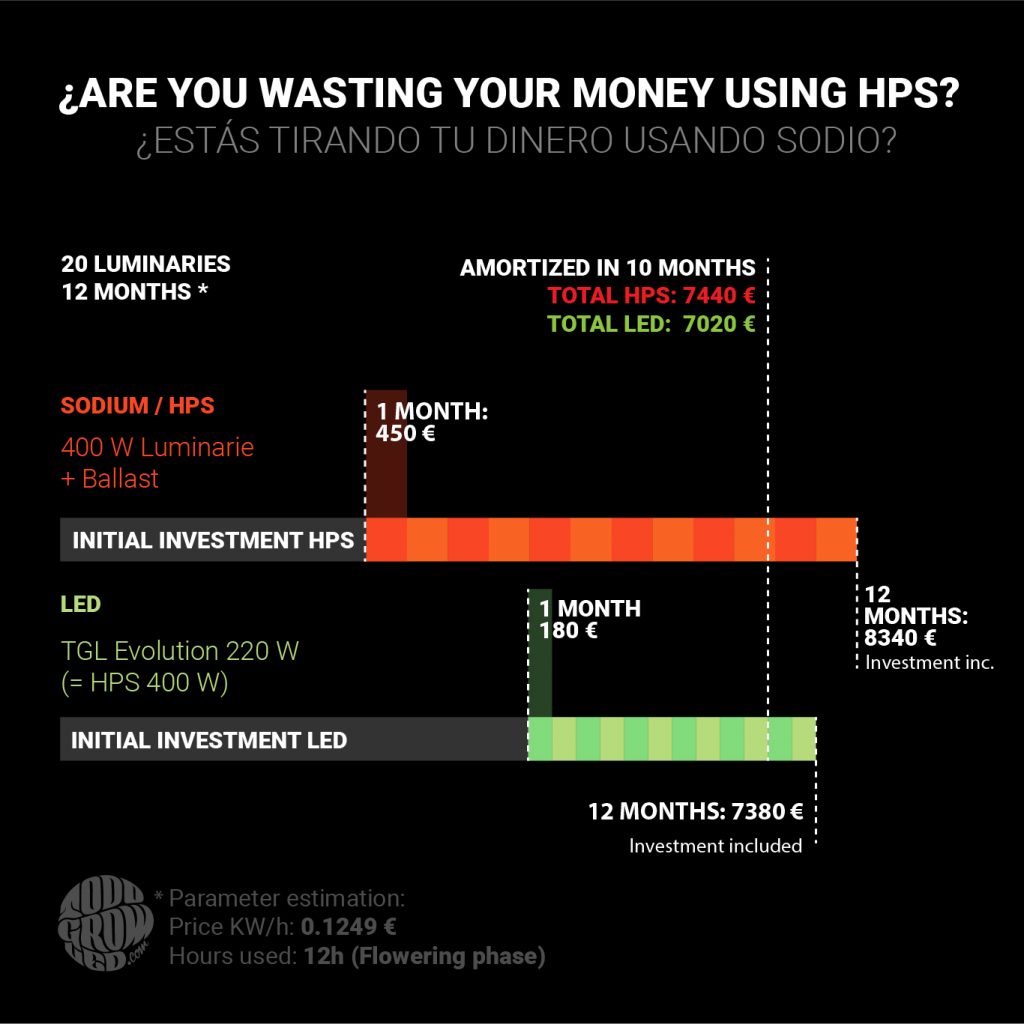
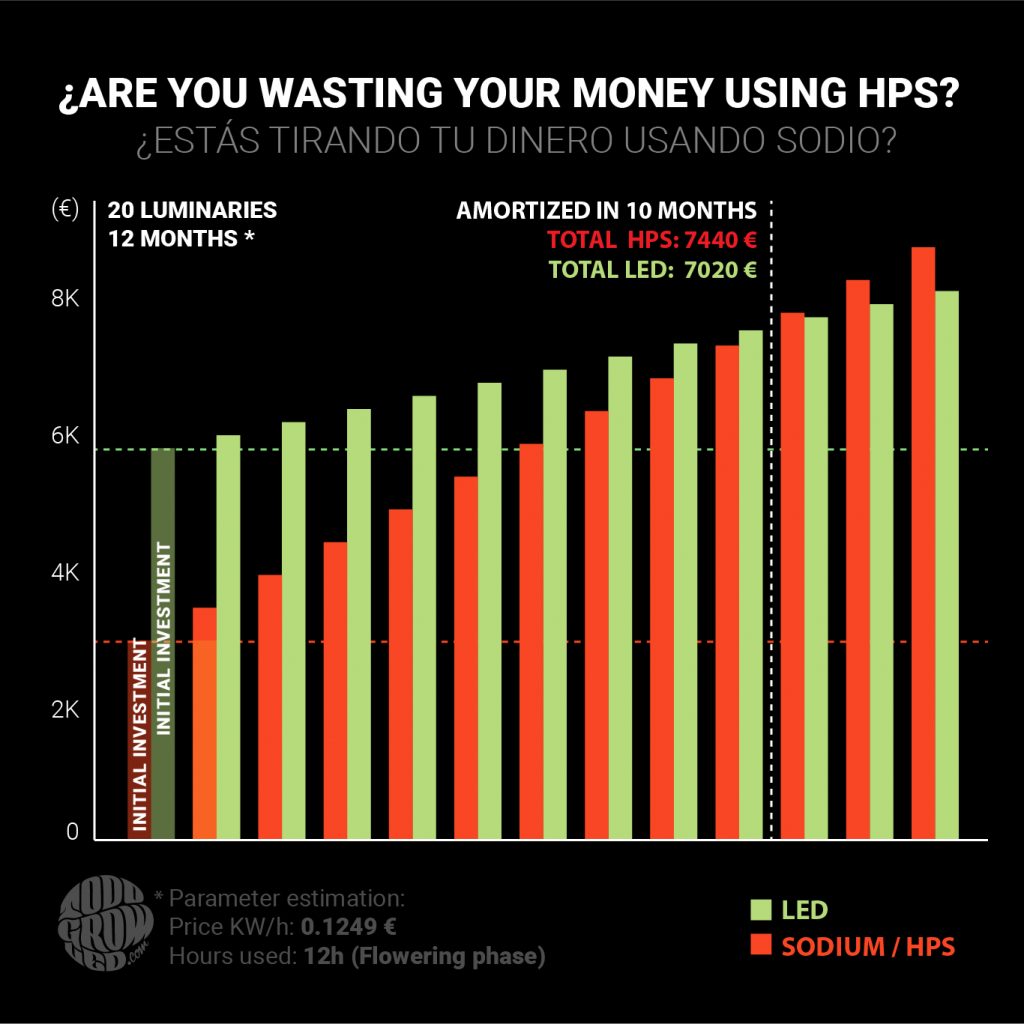
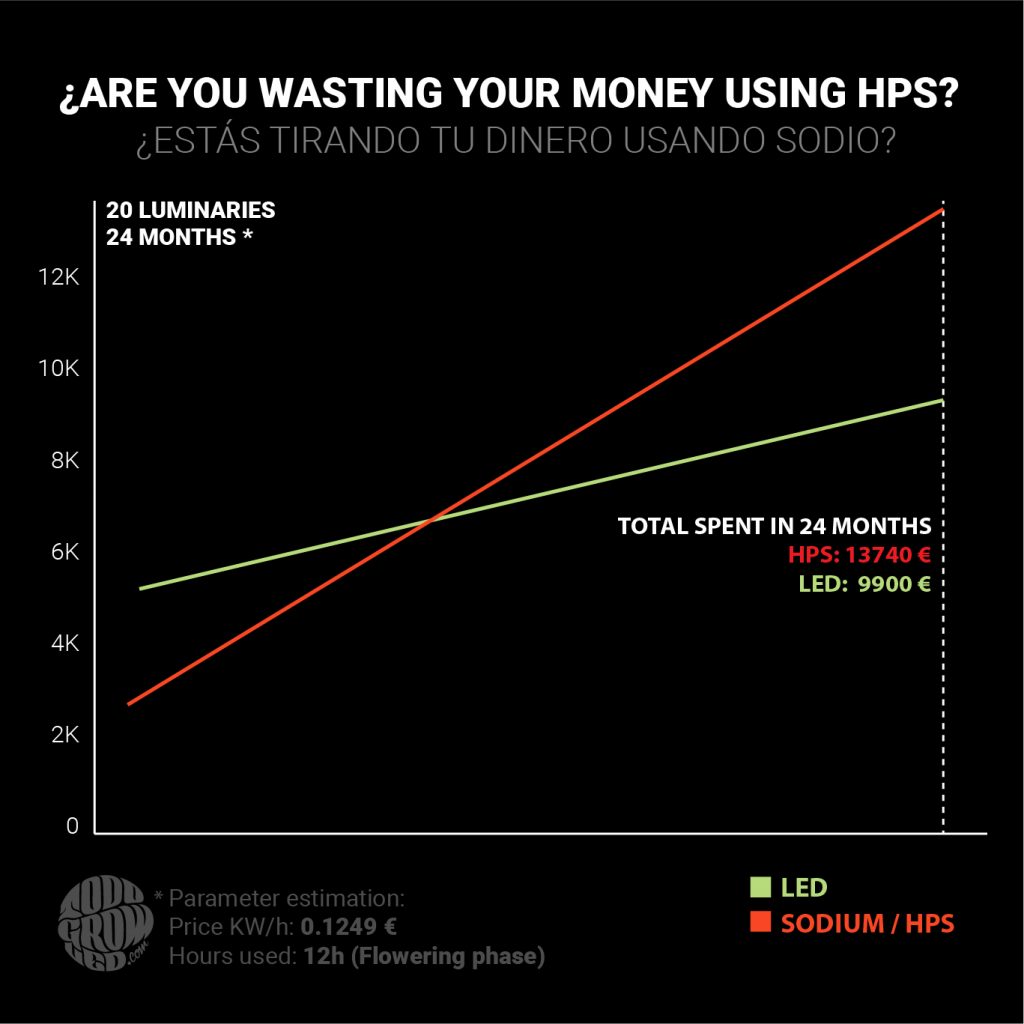
Among the many instagram & social media strategies I designed infographics as support for the message. In this case the price of the electricity bill was the incentive to switch to LED equipment.
Again, the spectrums. This was a really difficult topic to understand for many customers, so we kept publishing spectrum infographics to make sure everybody was aware of which spectrum was for seeds, veg of flowering phases (among many others).
In this case, in Instagram posts we need a really visual aesthetic, so we incorporated the nebula textures that ended up being a very useful branding characteristic in TodogrowLED since it helped us to immediately communicate the clients the kind of product depending on the nebulas in the post or in the product page.
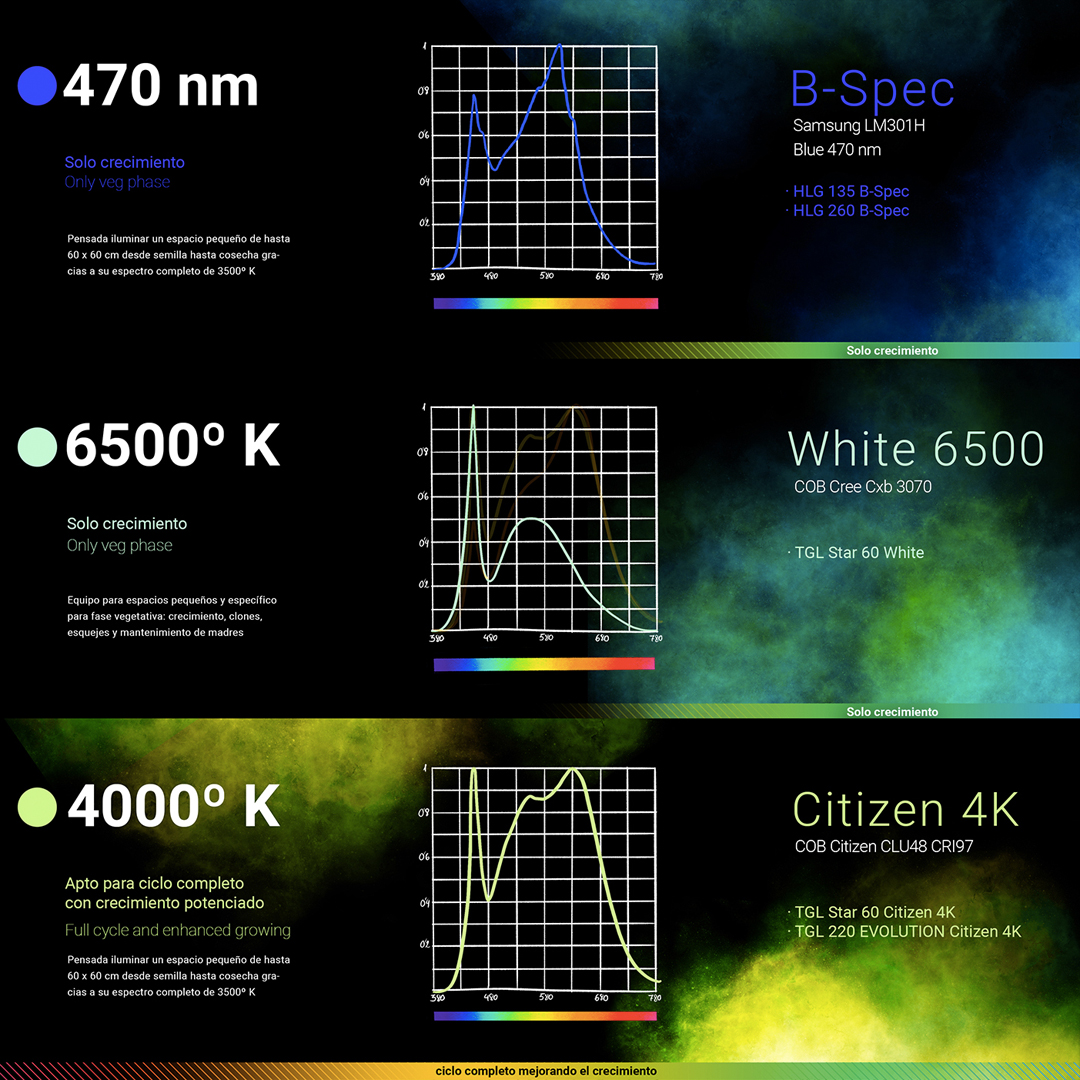
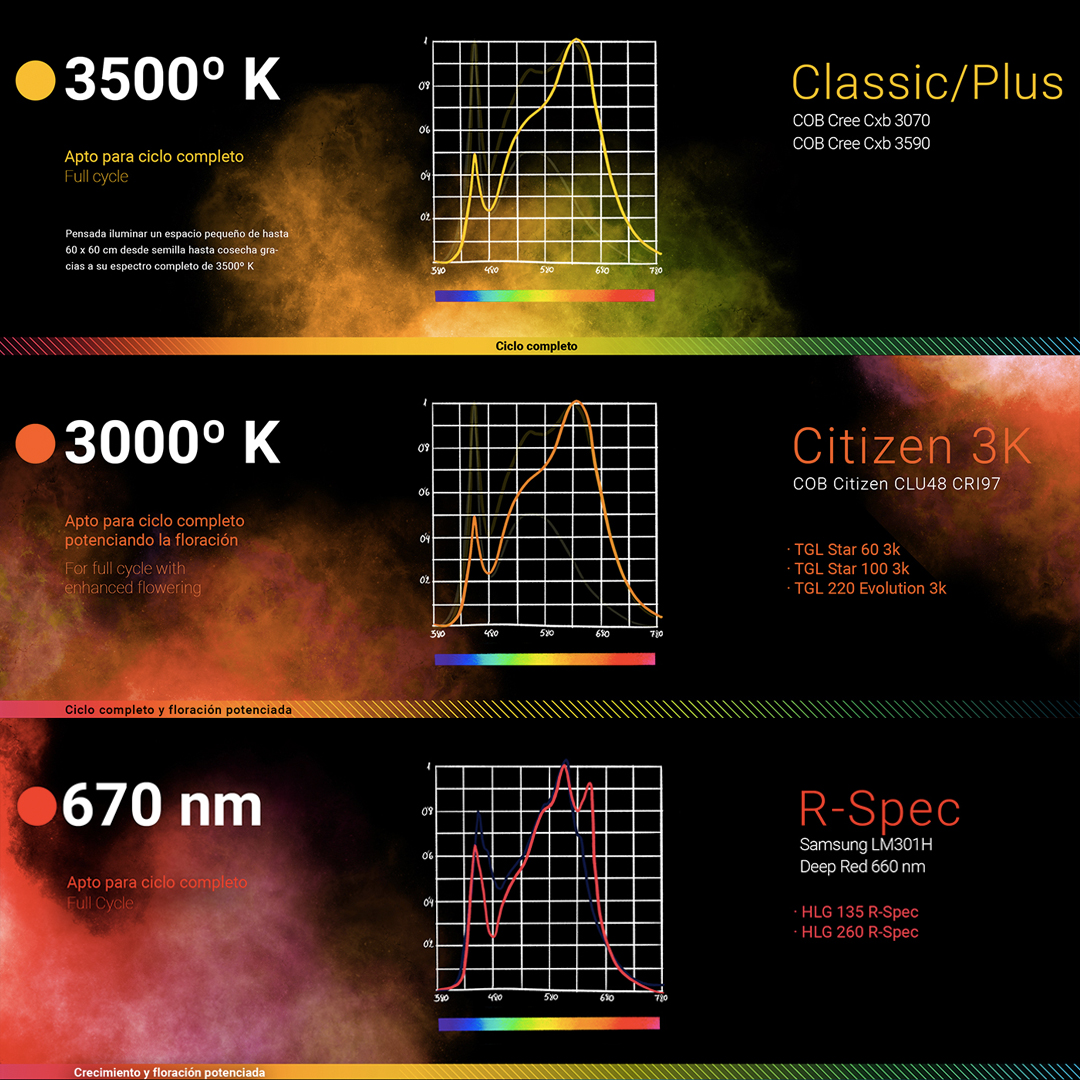
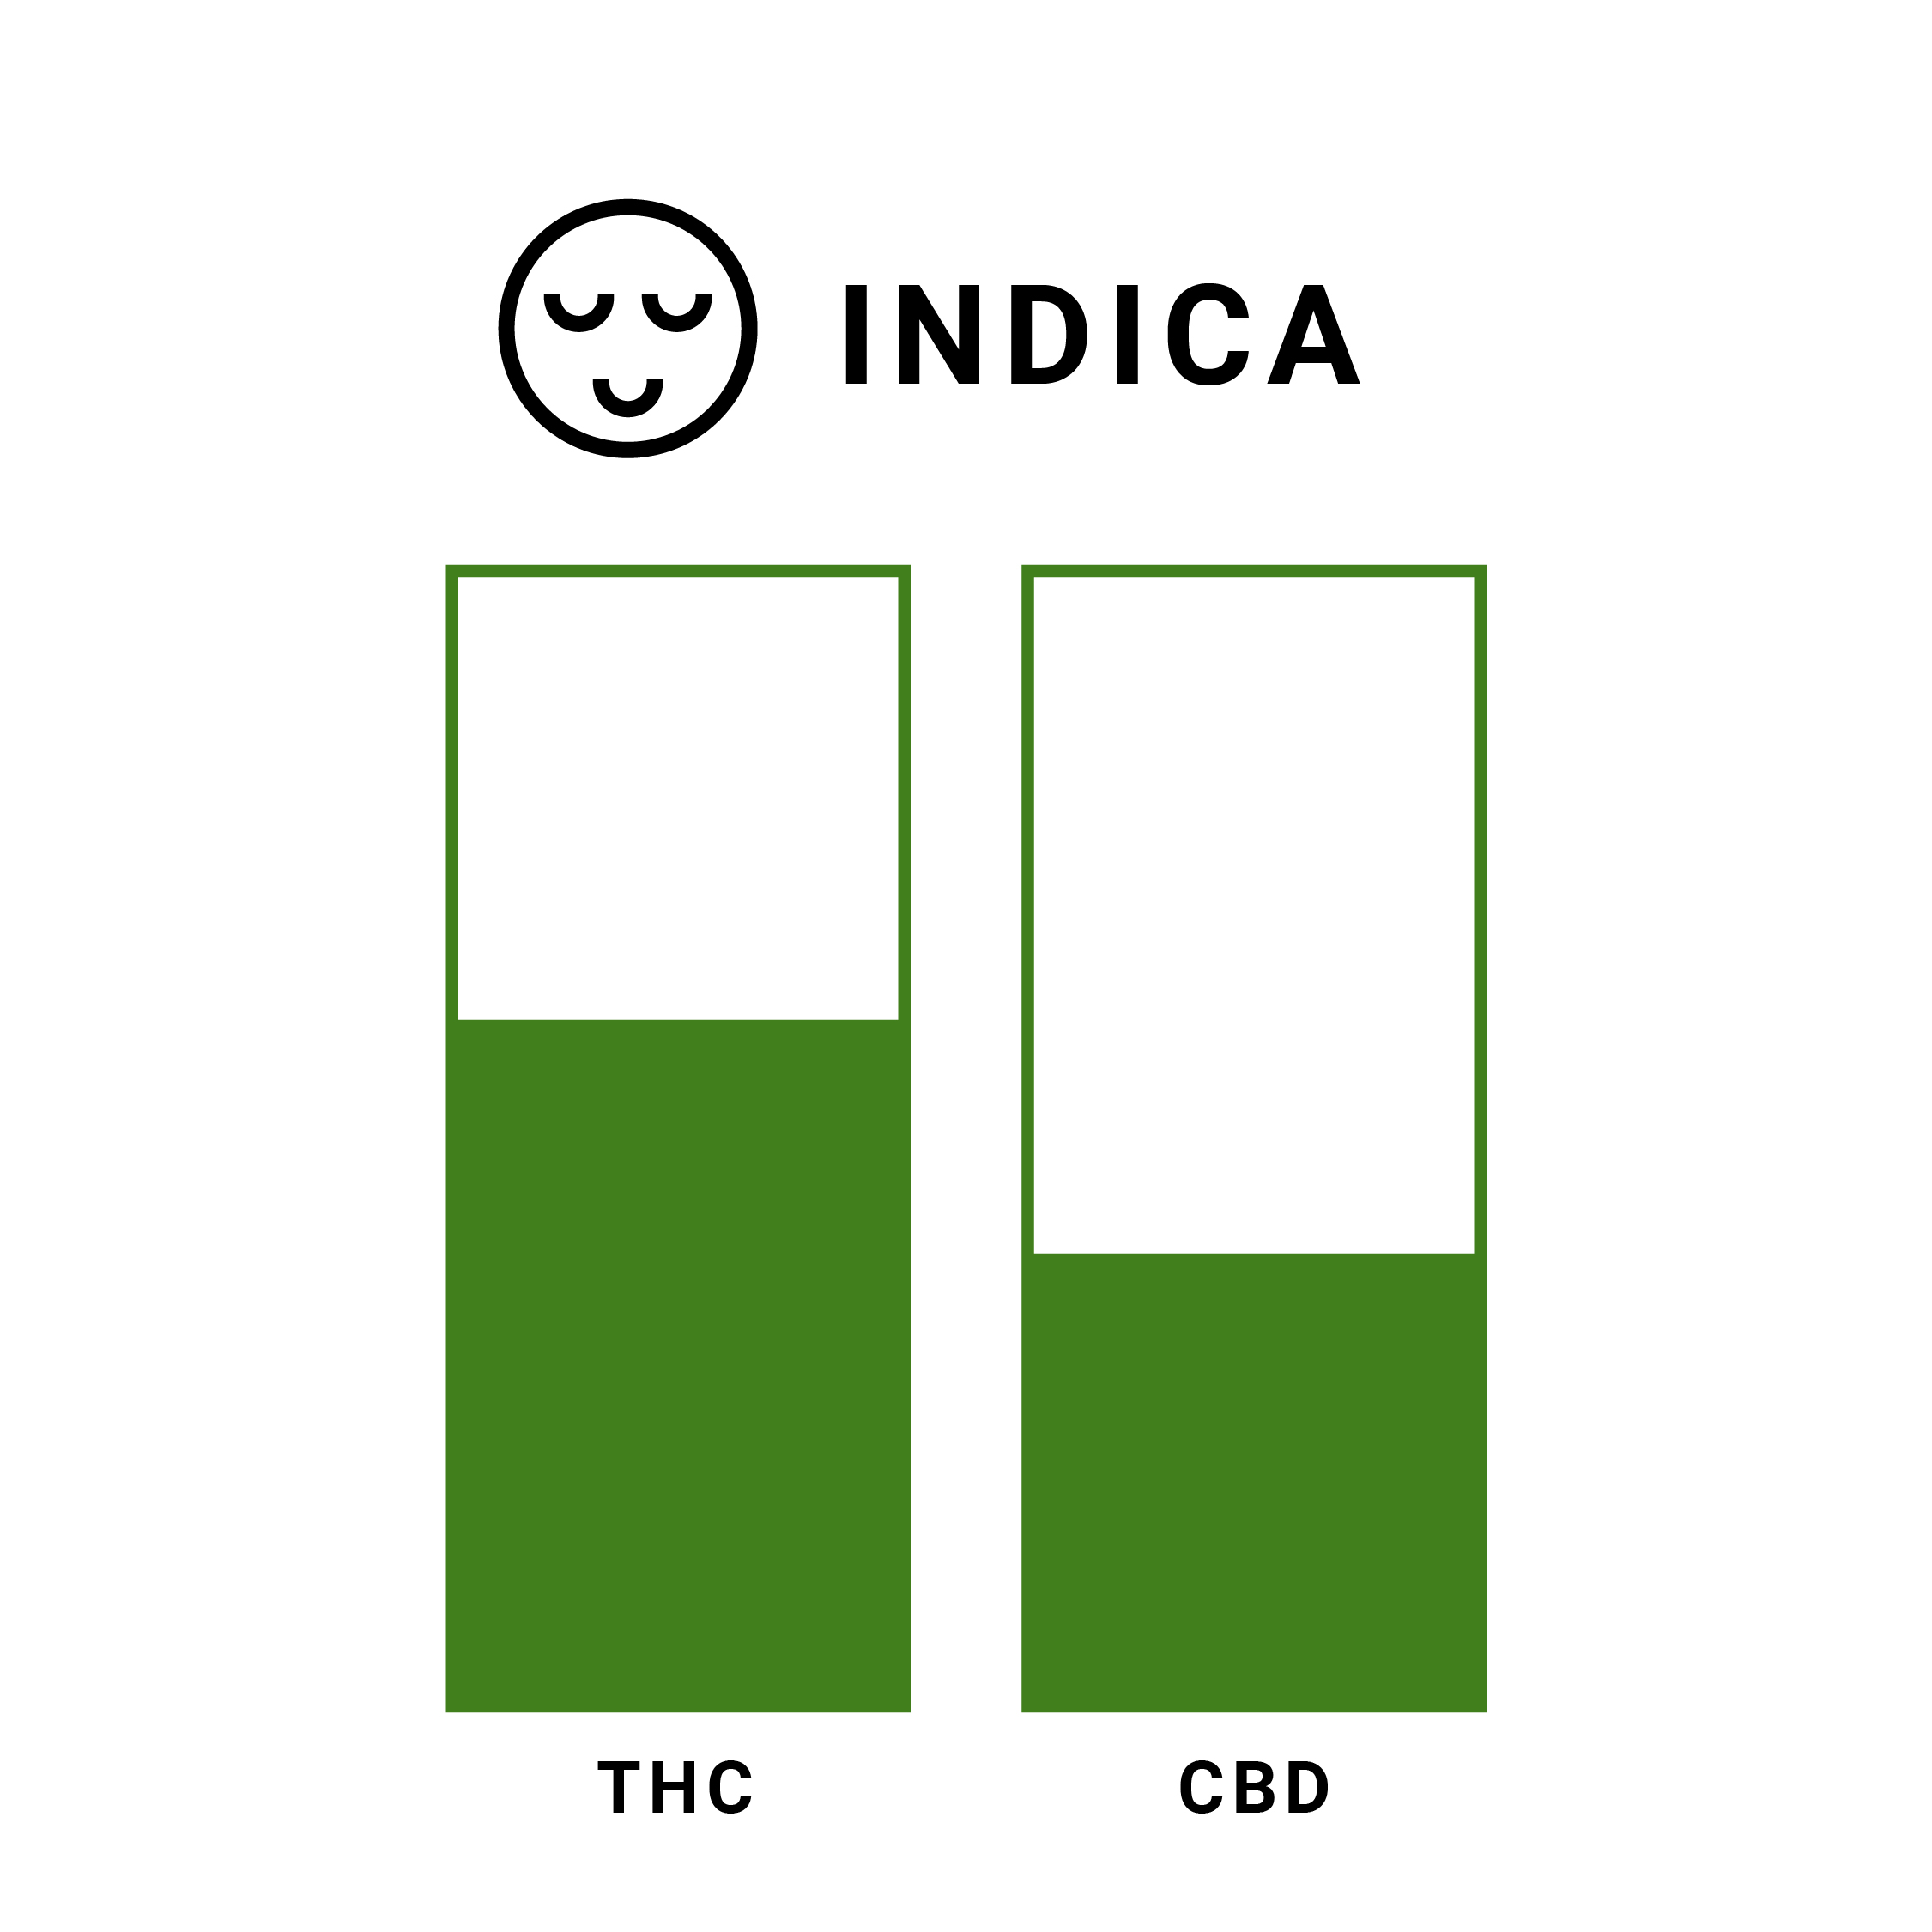
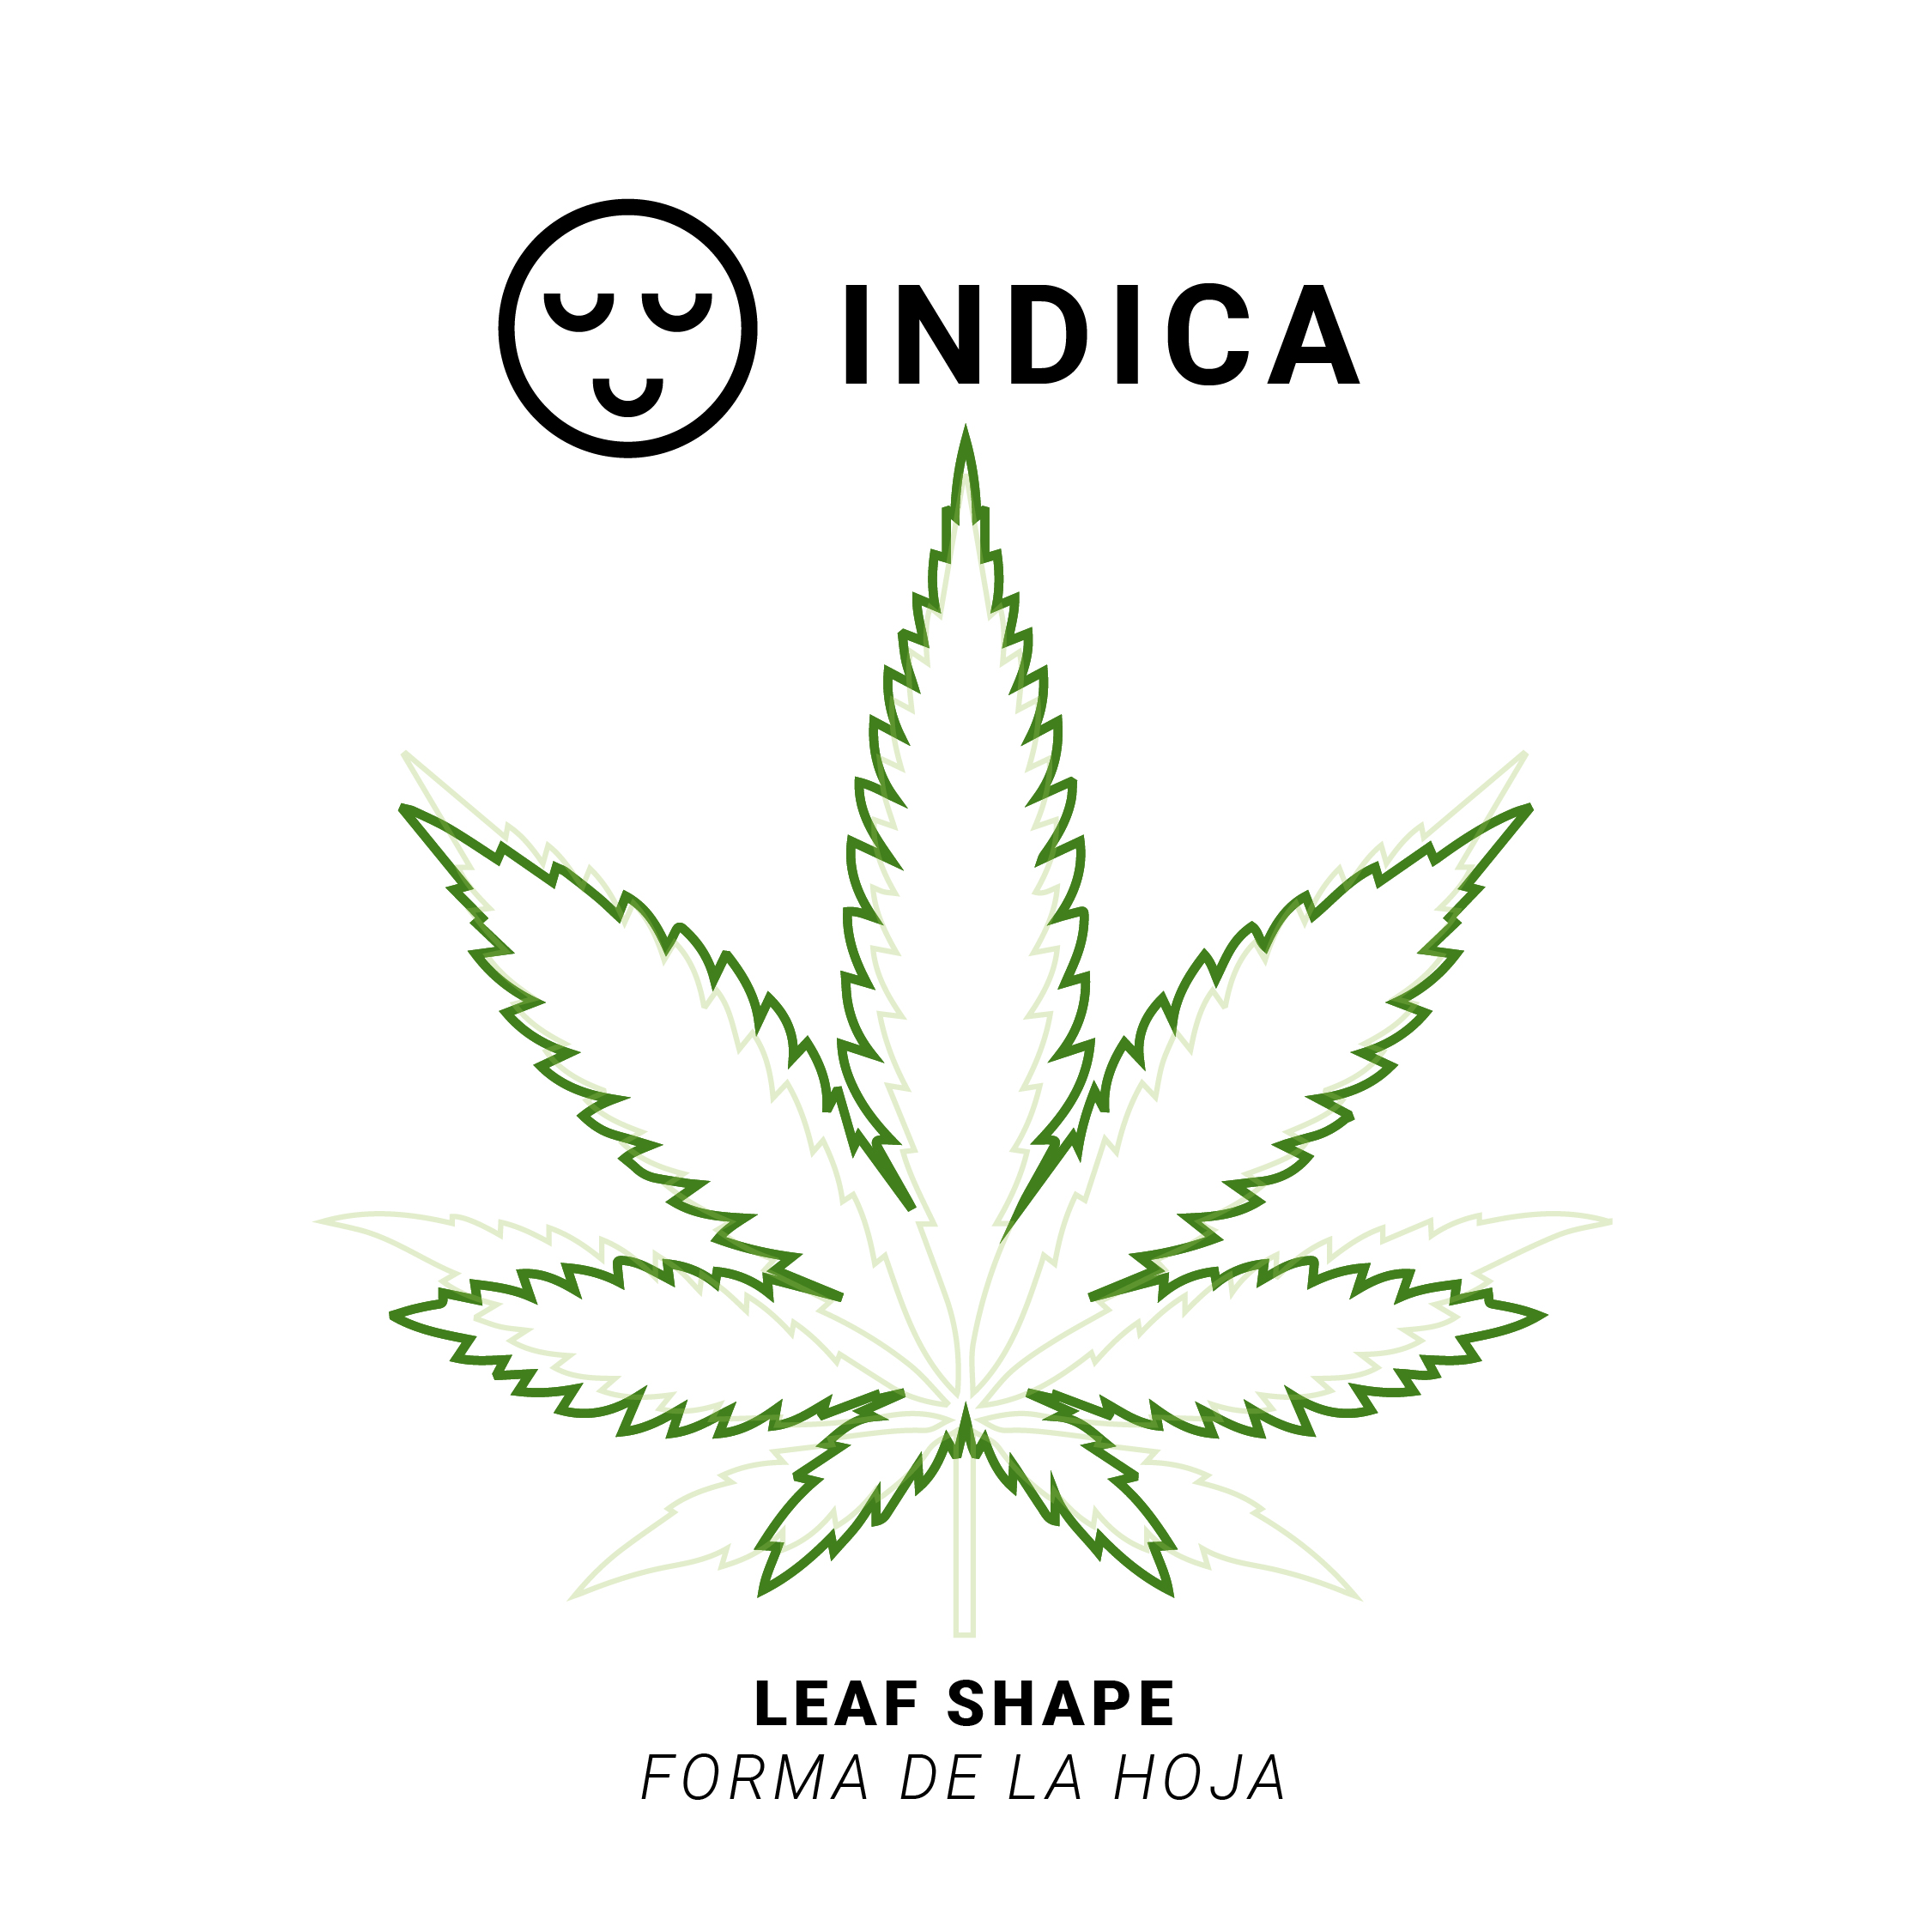
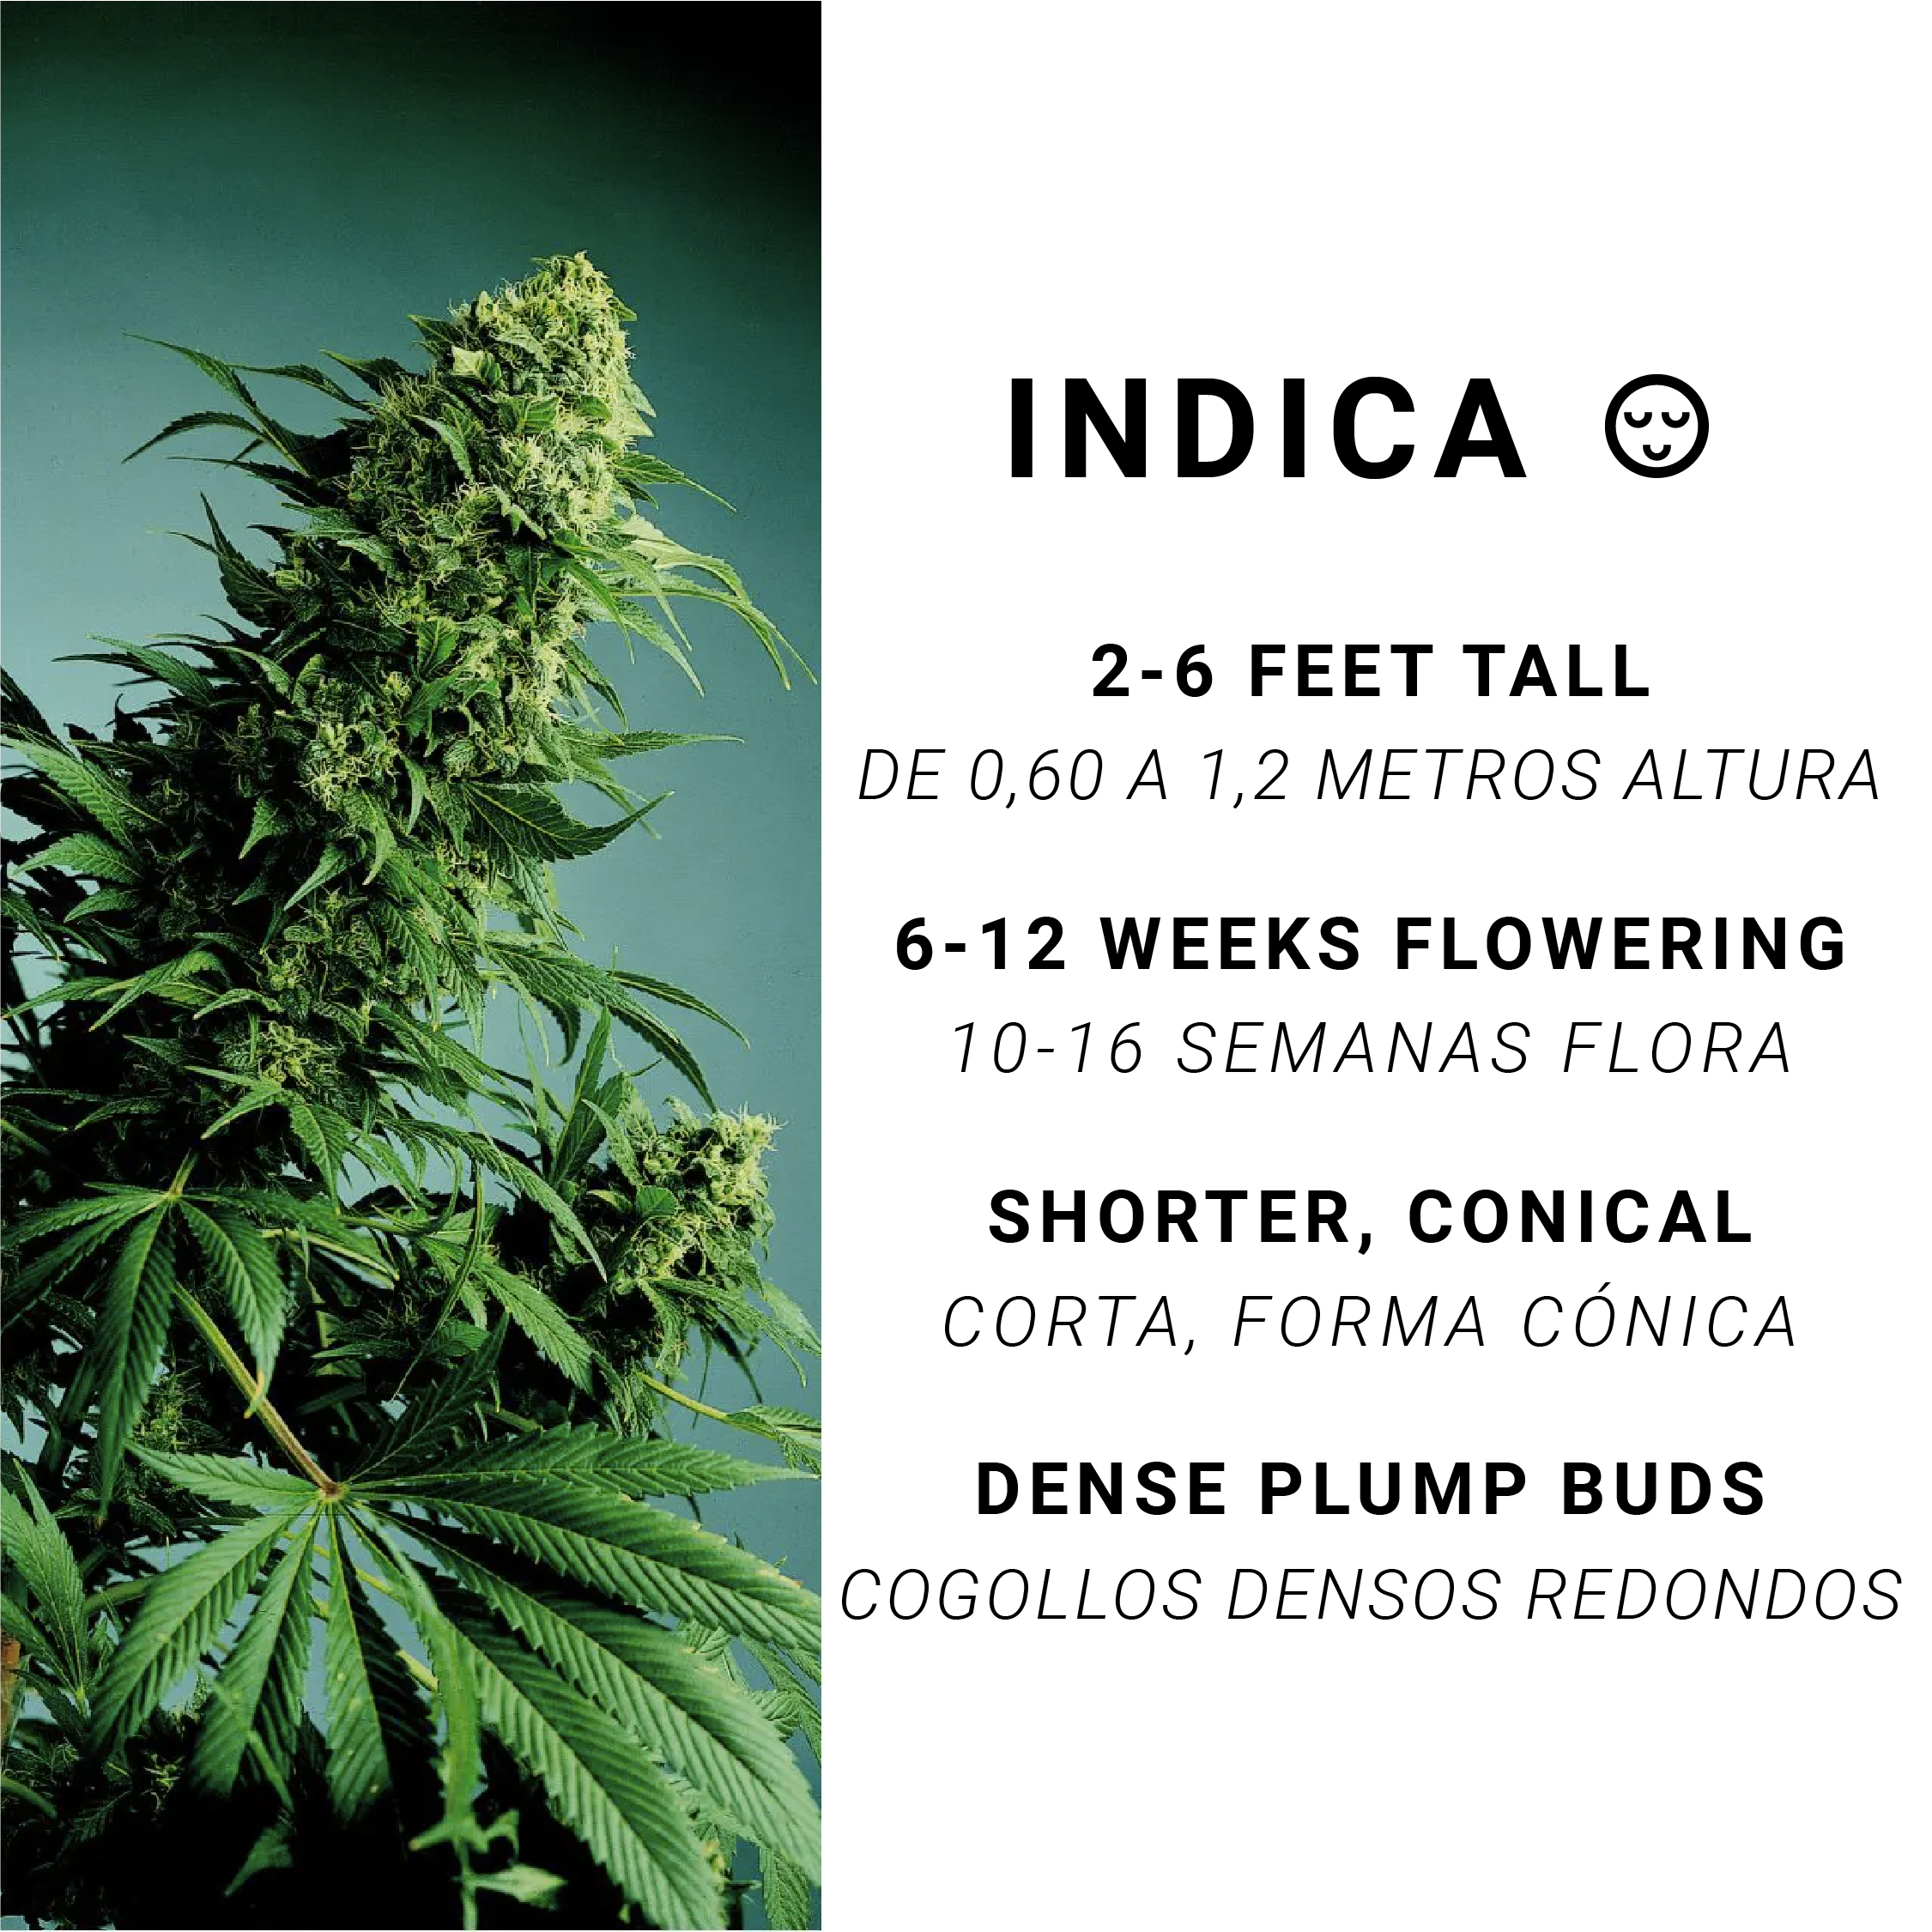
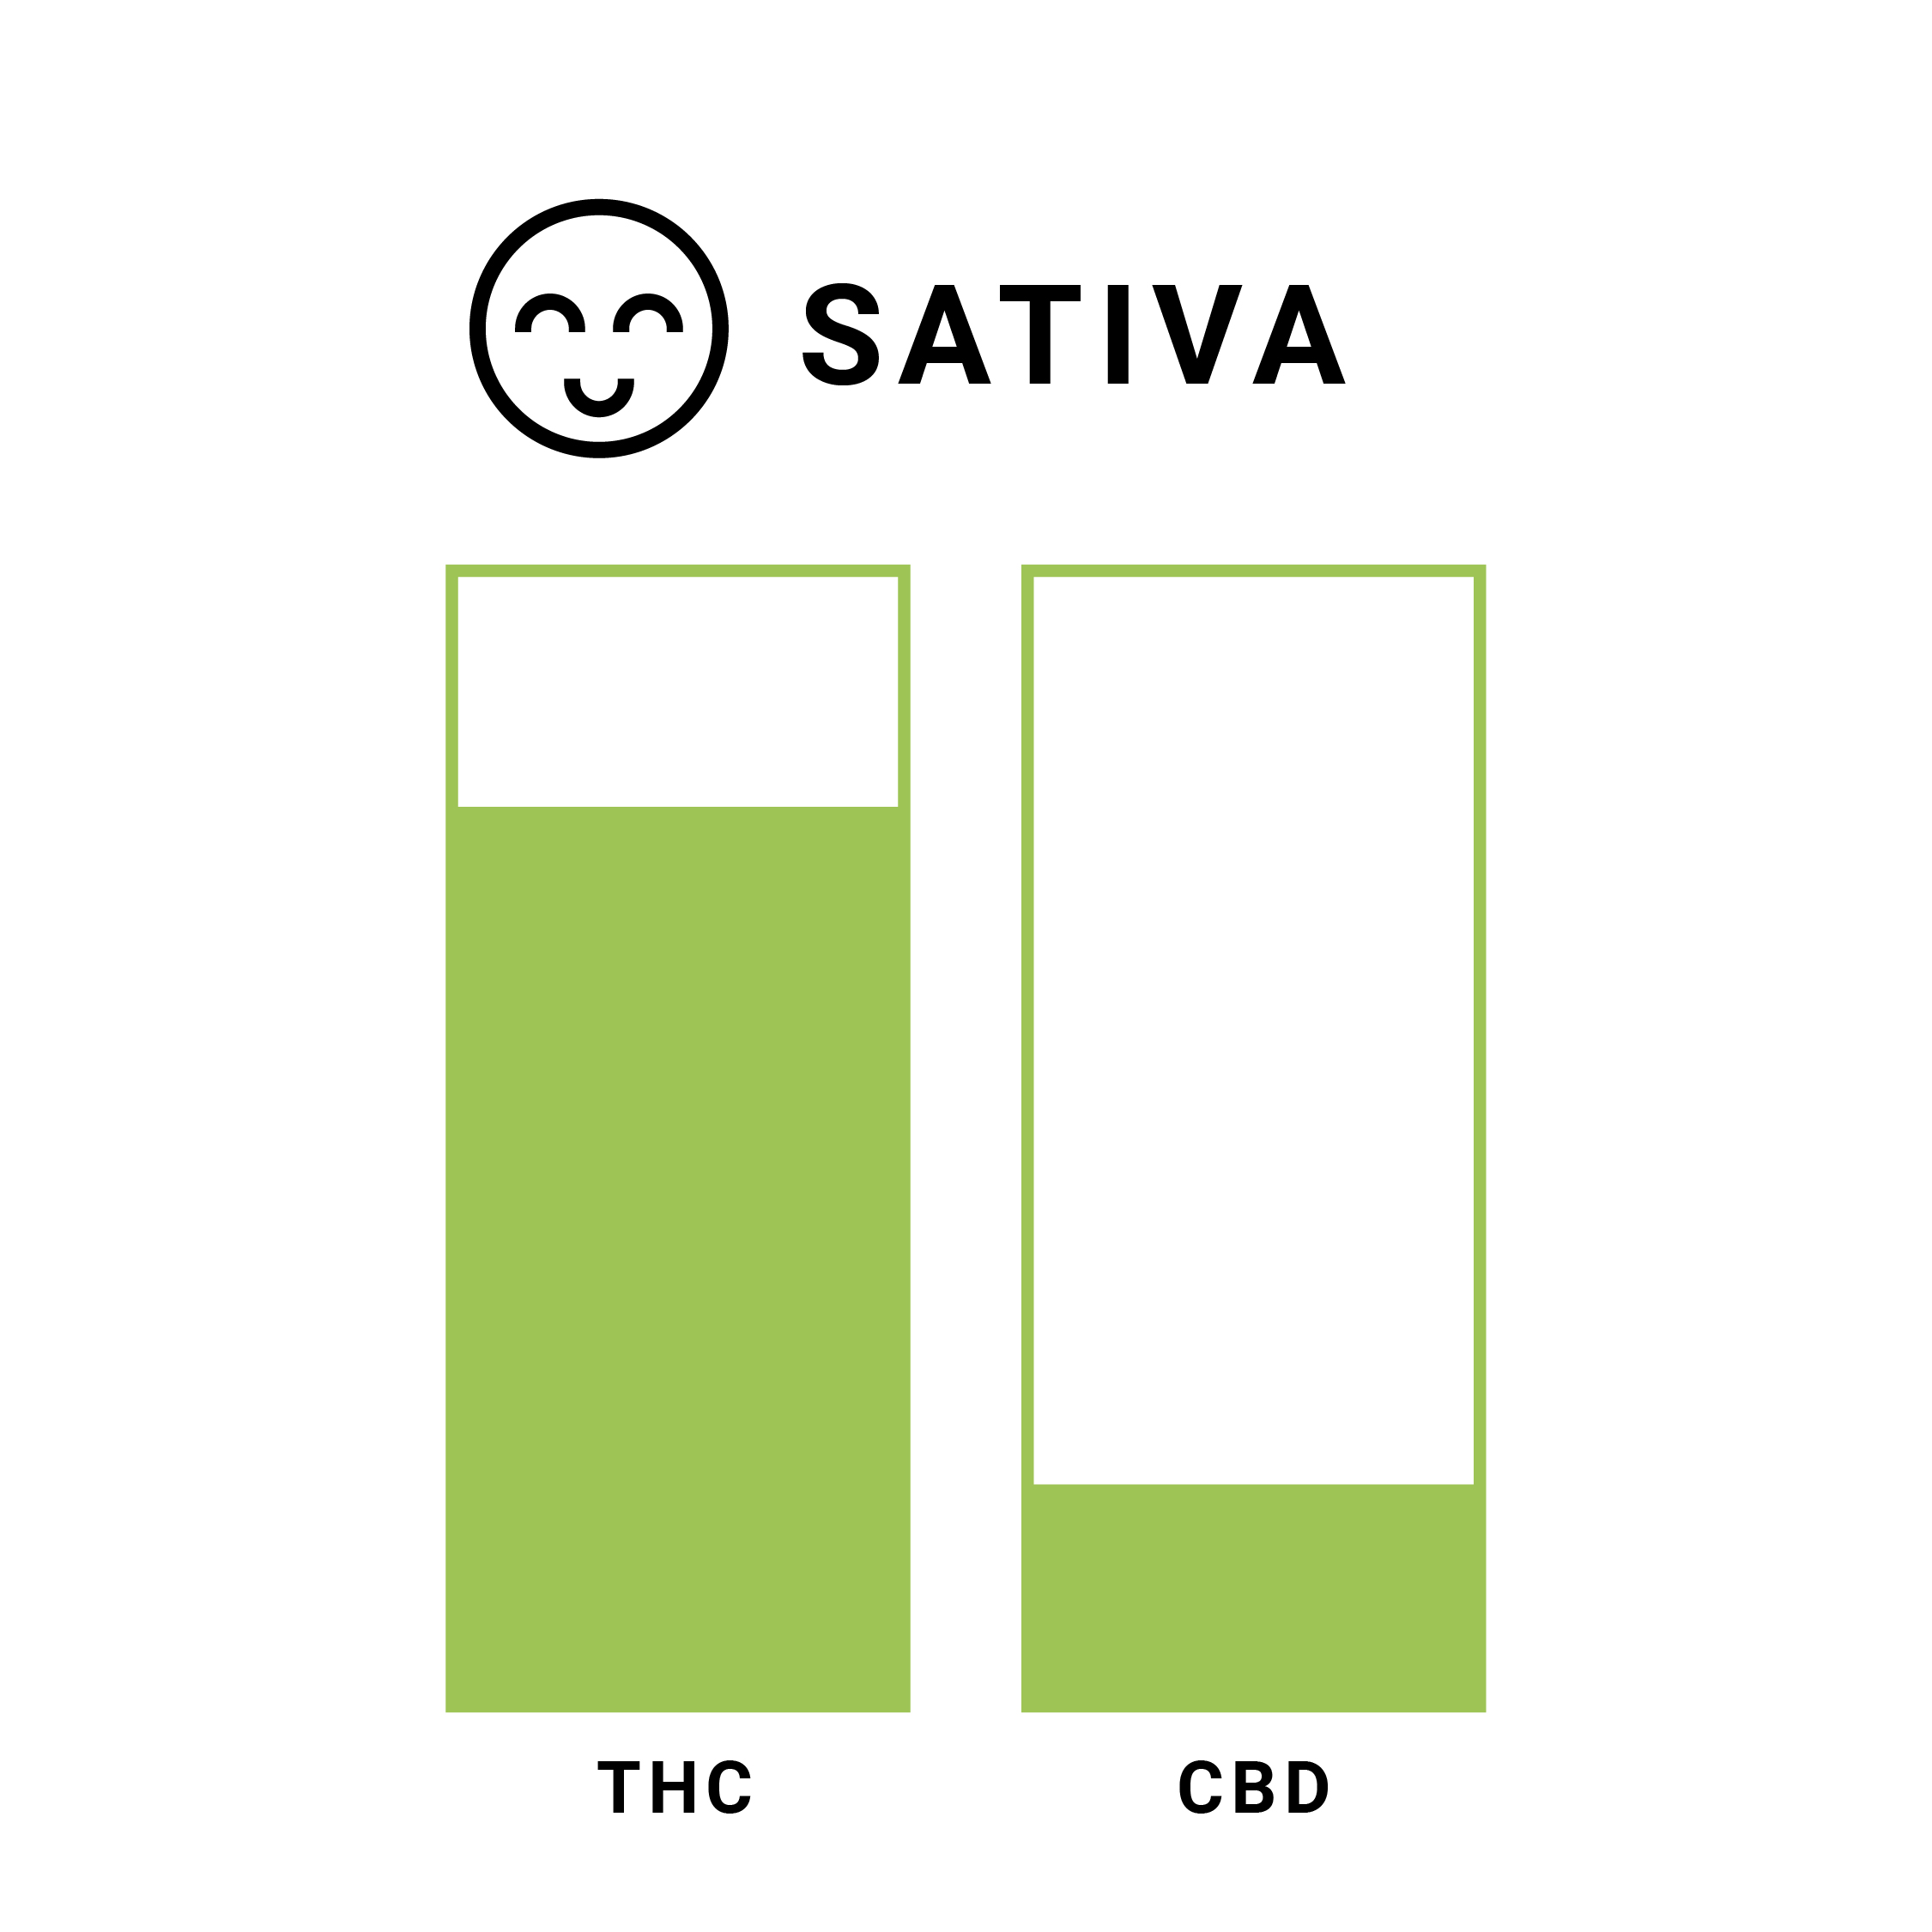
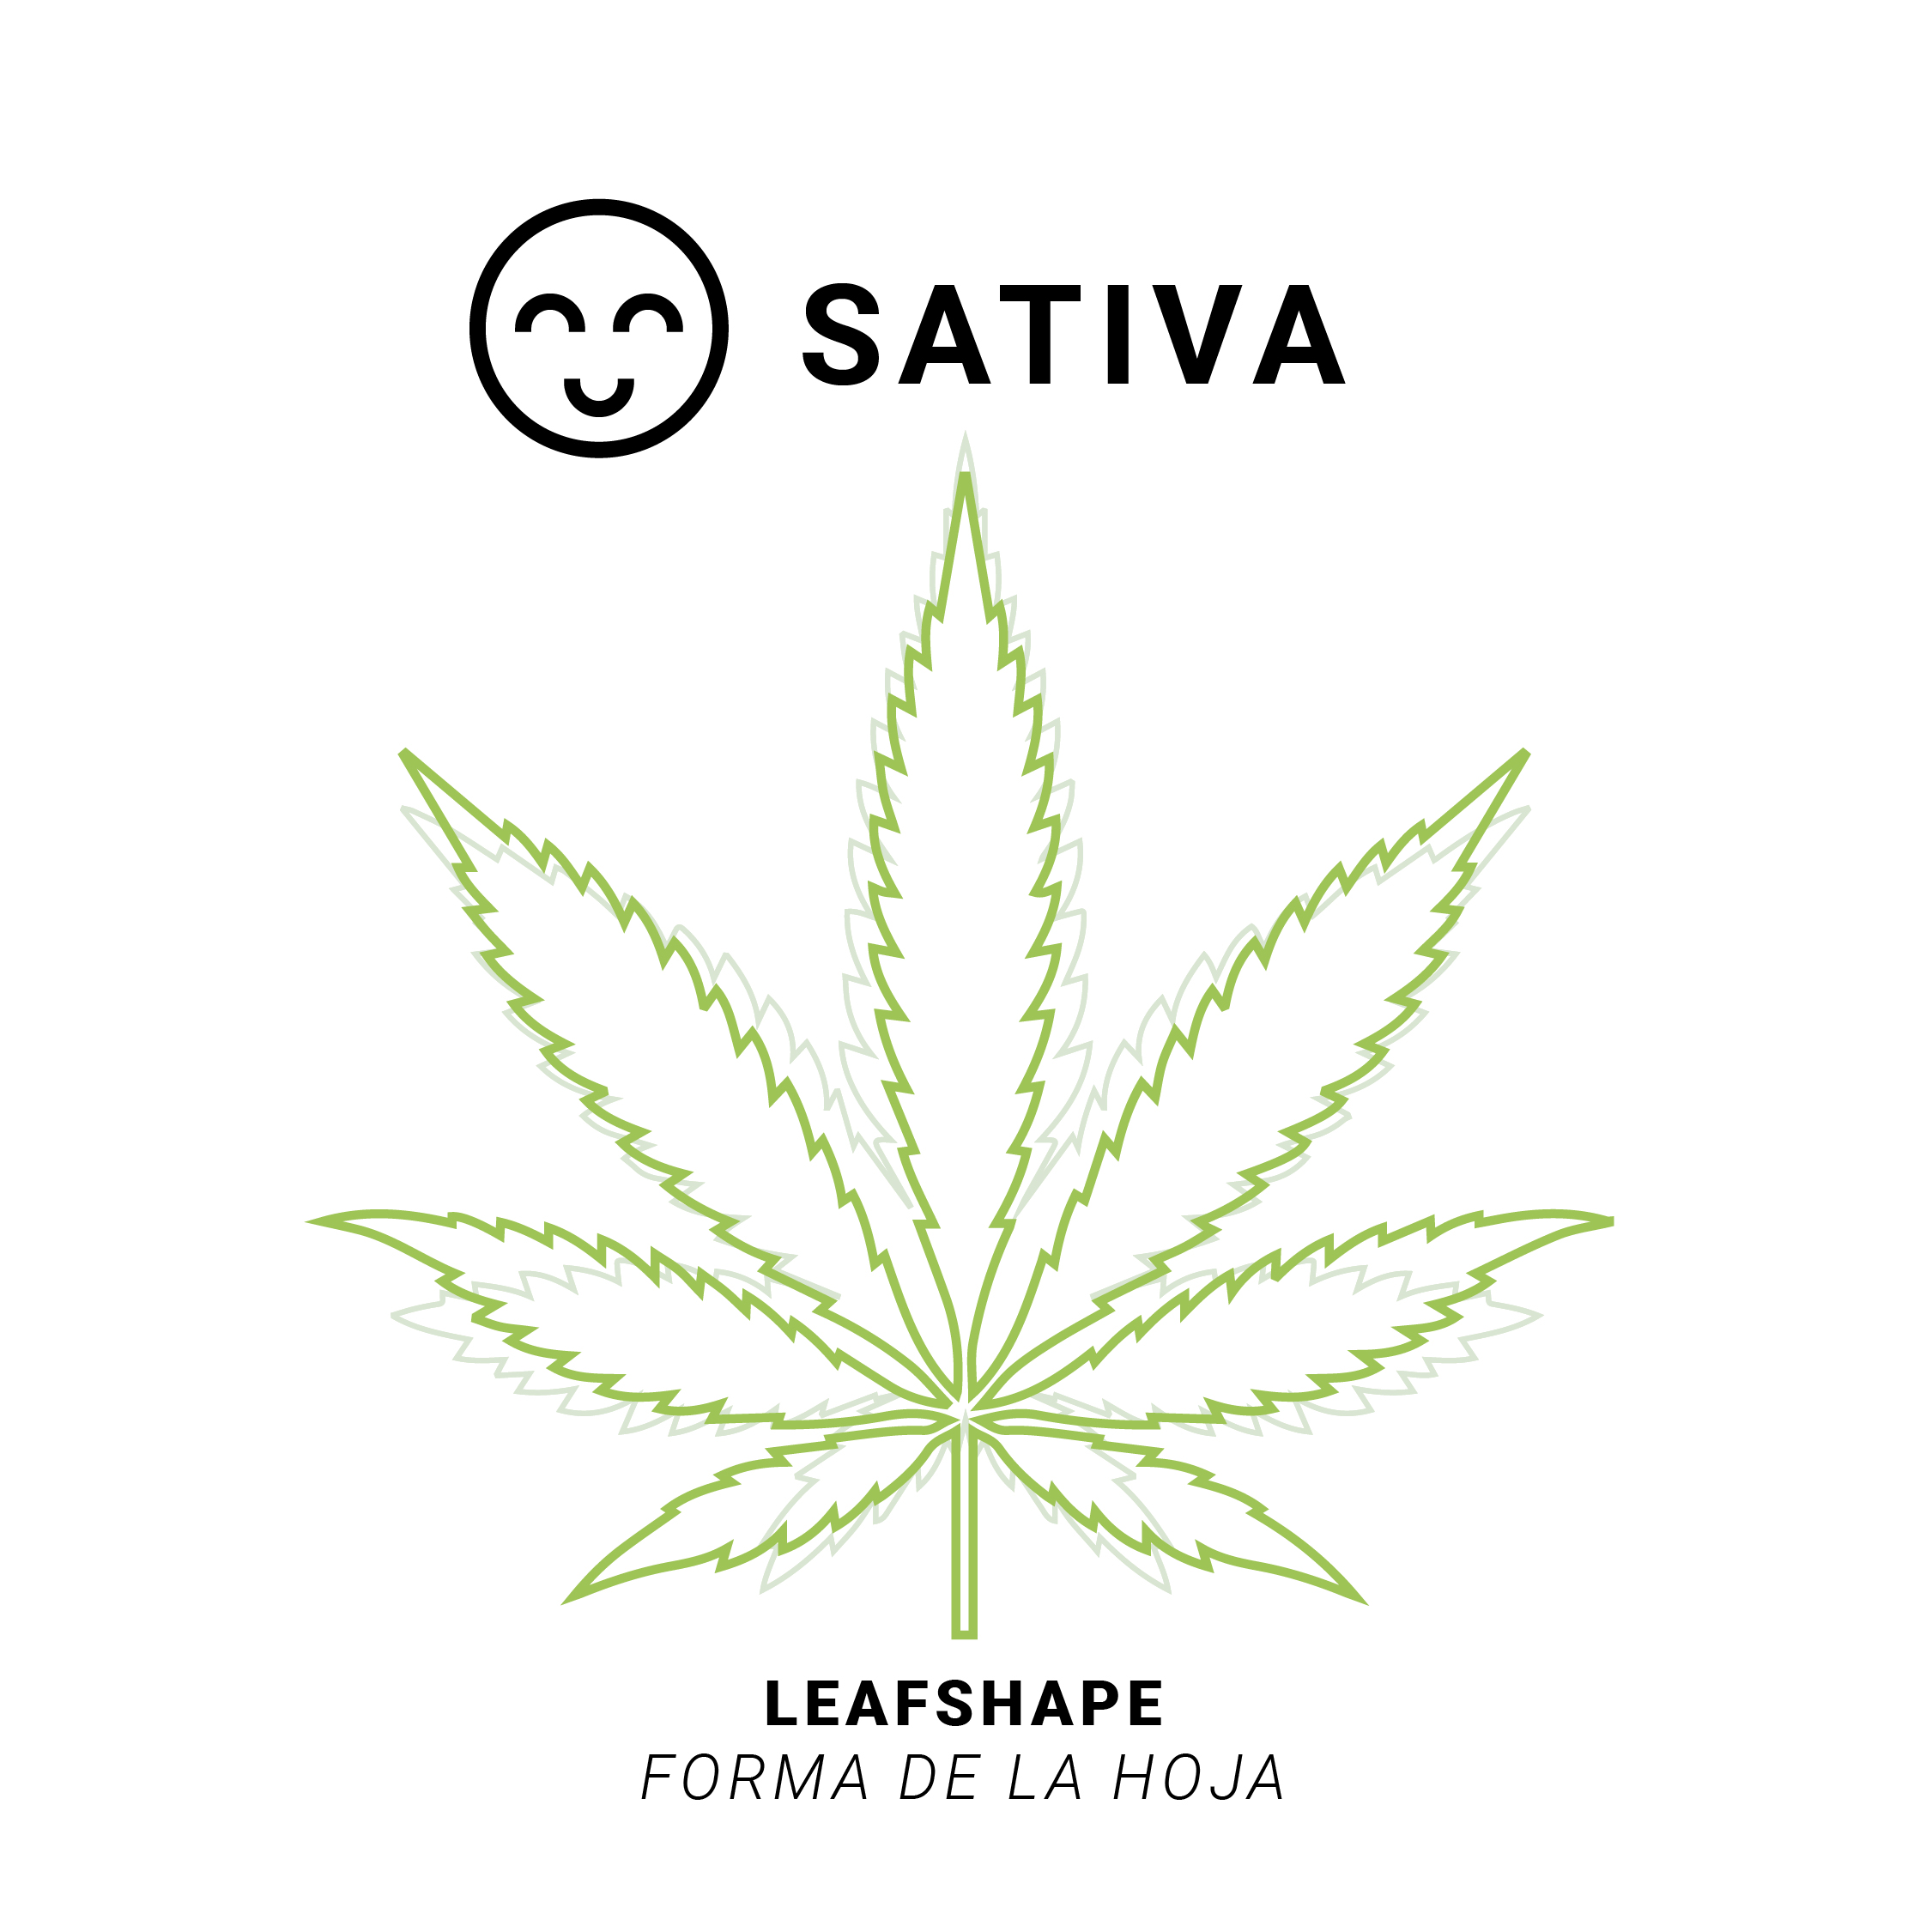
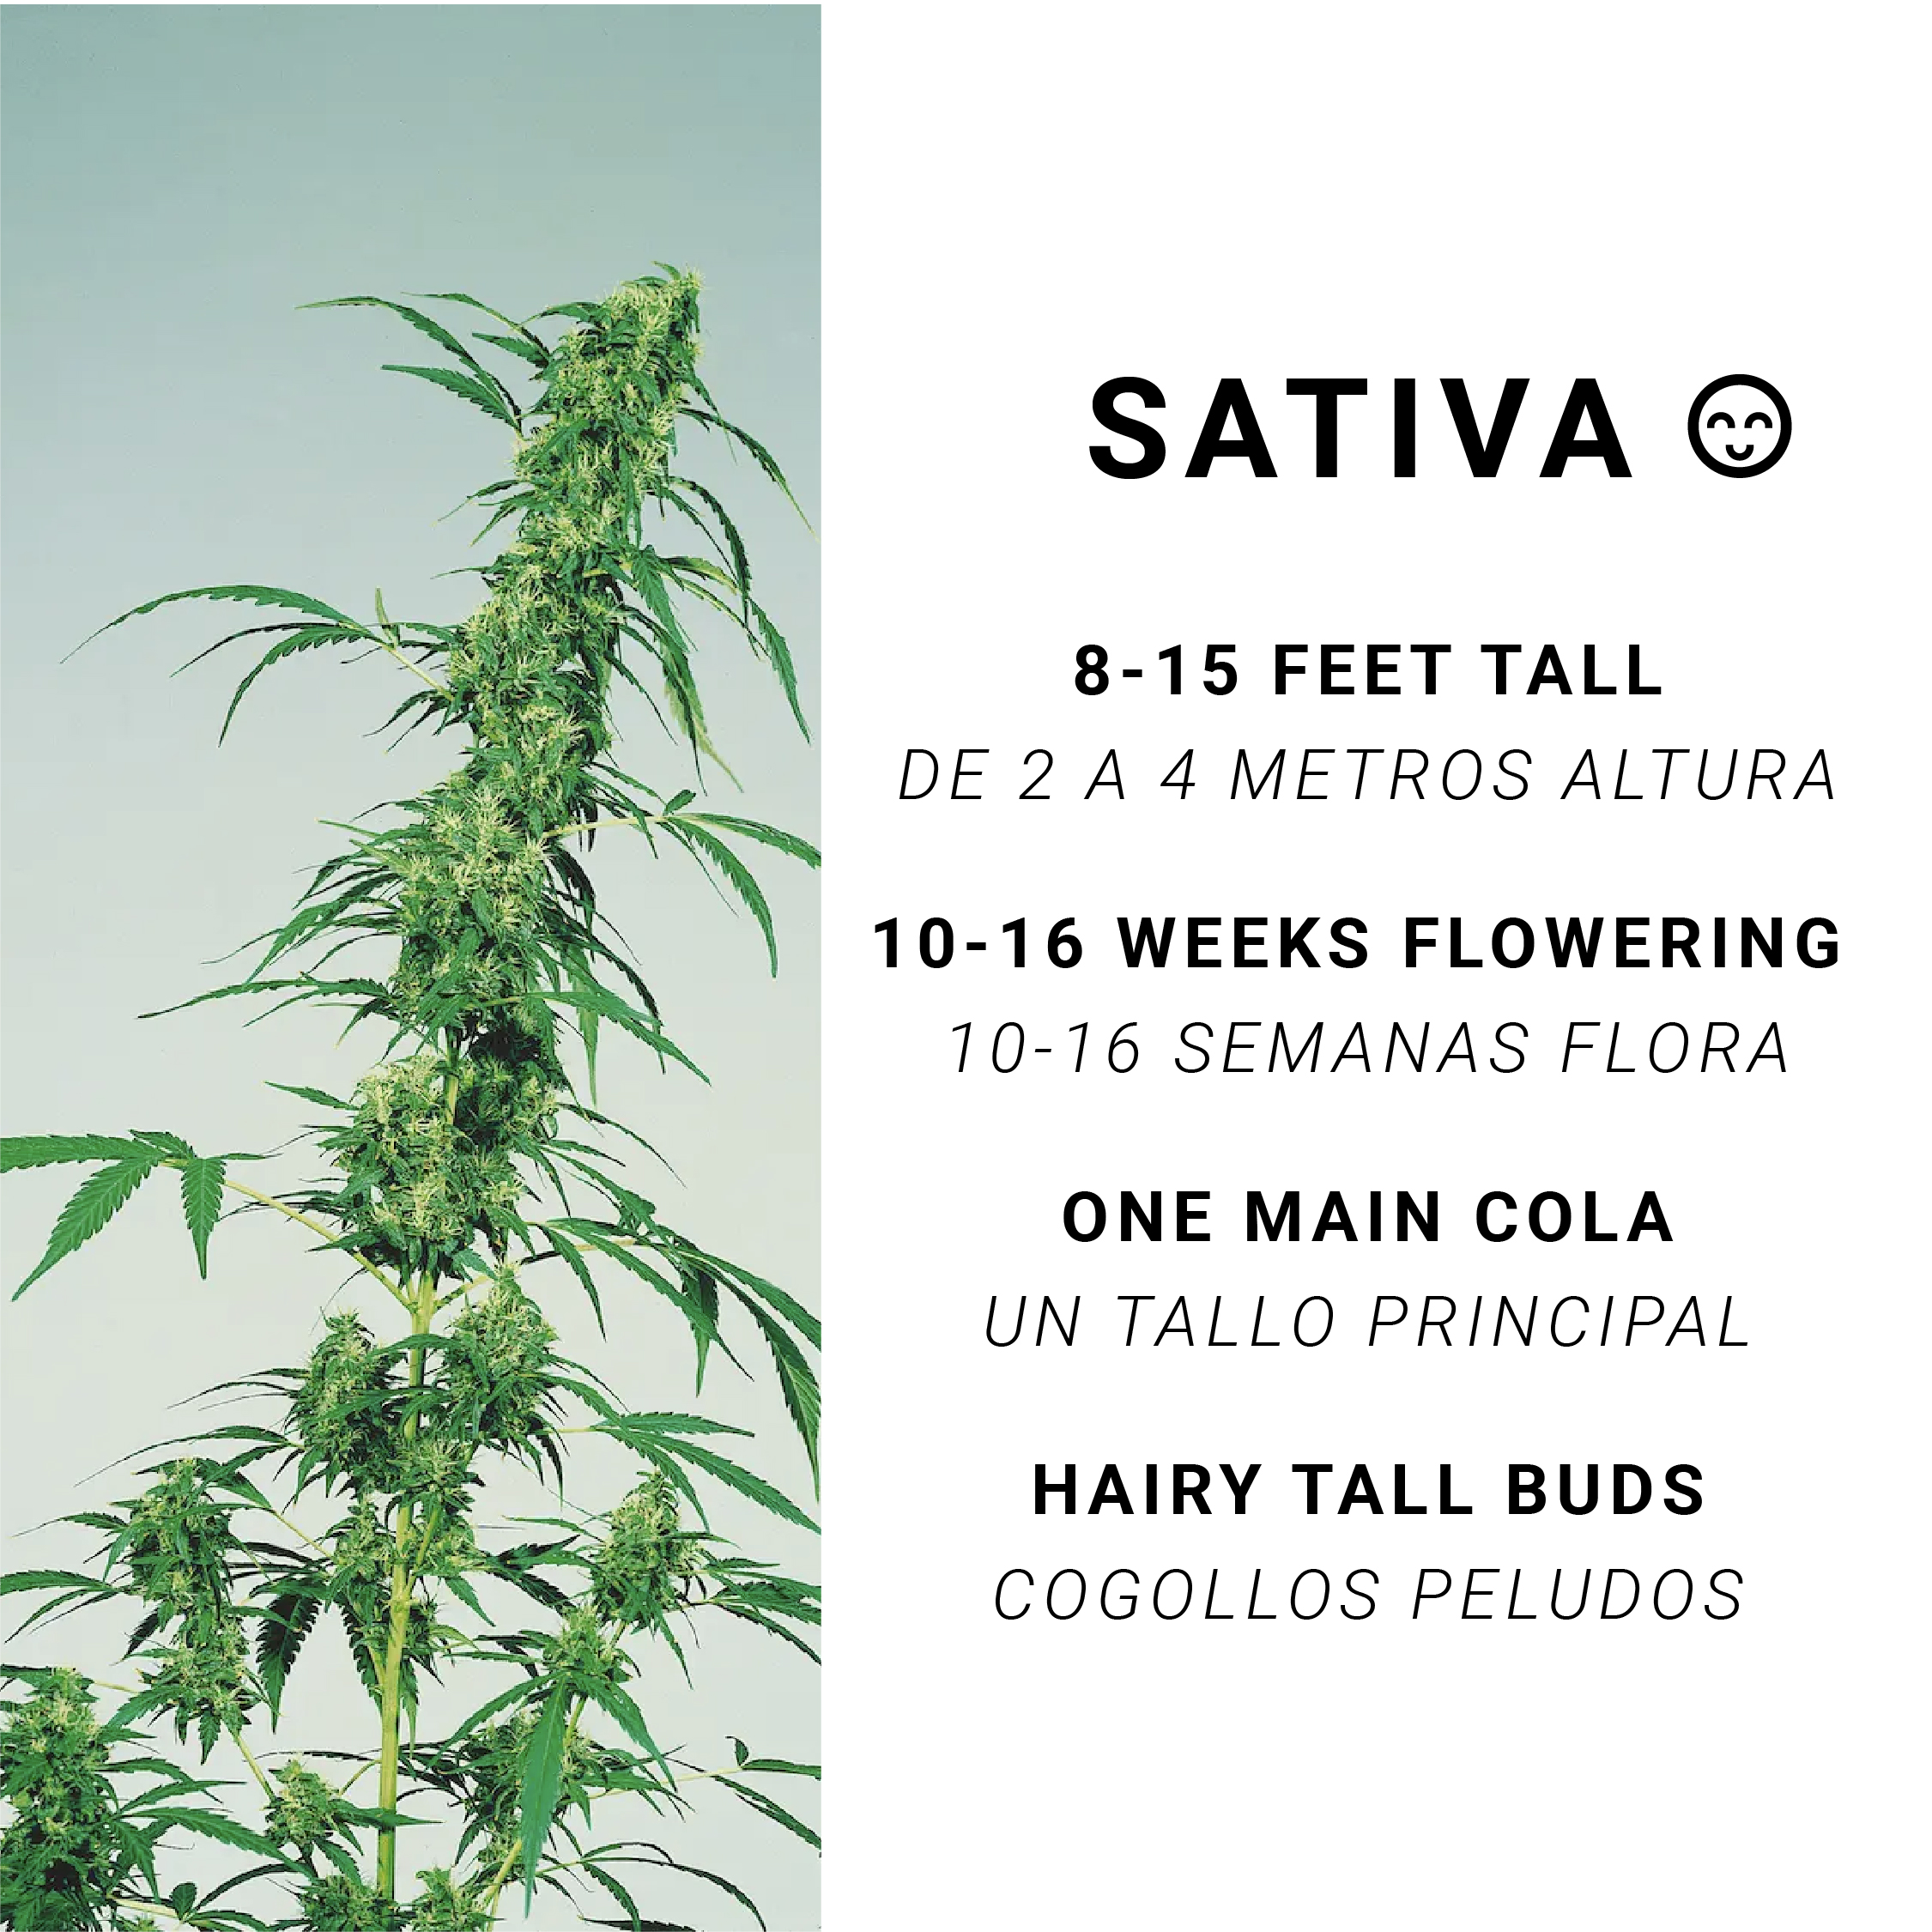
In this case, this content (which we named as «Customer education») was a recurrent section in which we selected a subject growing related as the size of the crop, growing in summer, plagues… This one is related to the type of seeds.
In this parallel posts you can compare the different kinds of plants and select the seeds that best suits your needs.
With these post our aim was to keep our «happy growers» community active and to be a reference in growing advices for newbies.
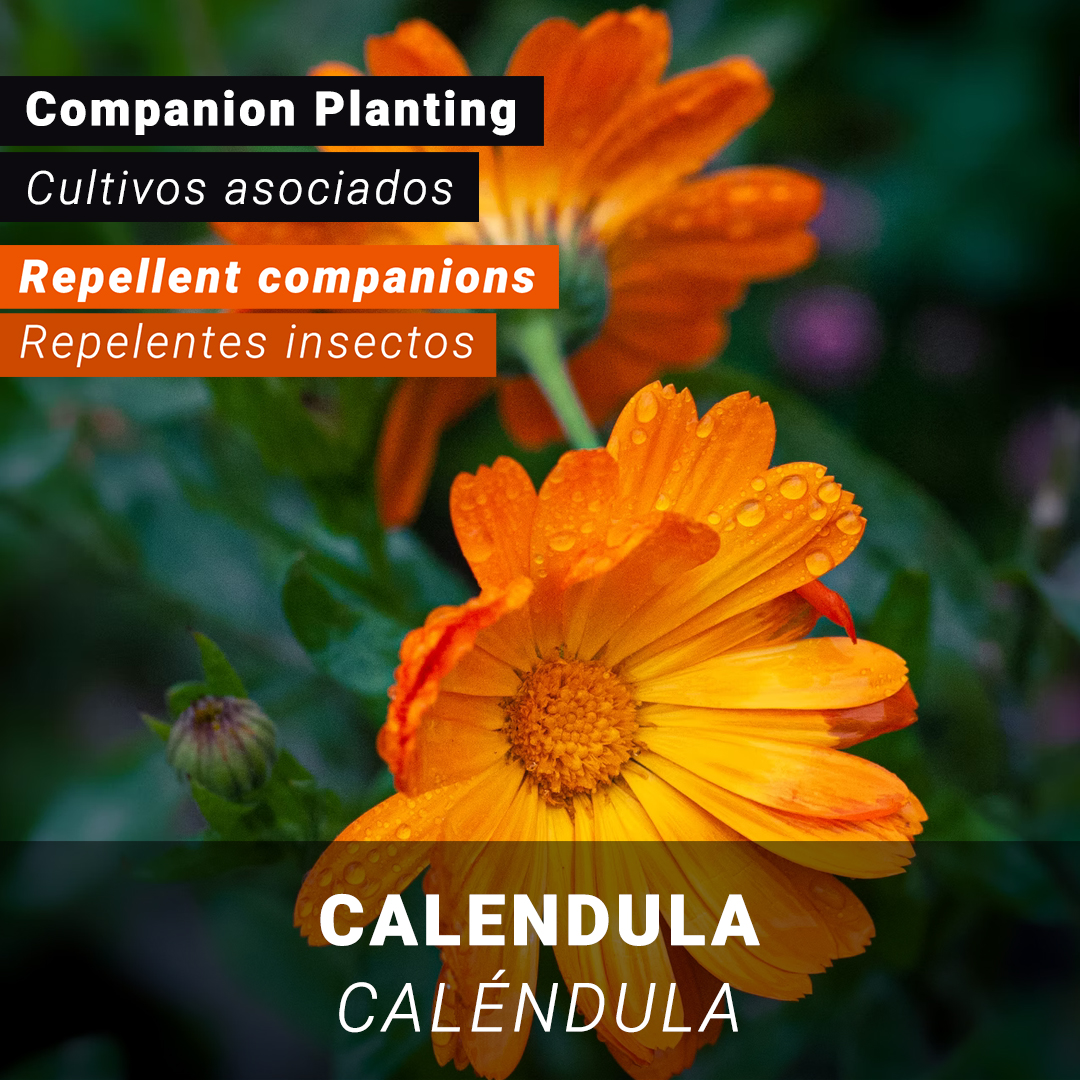
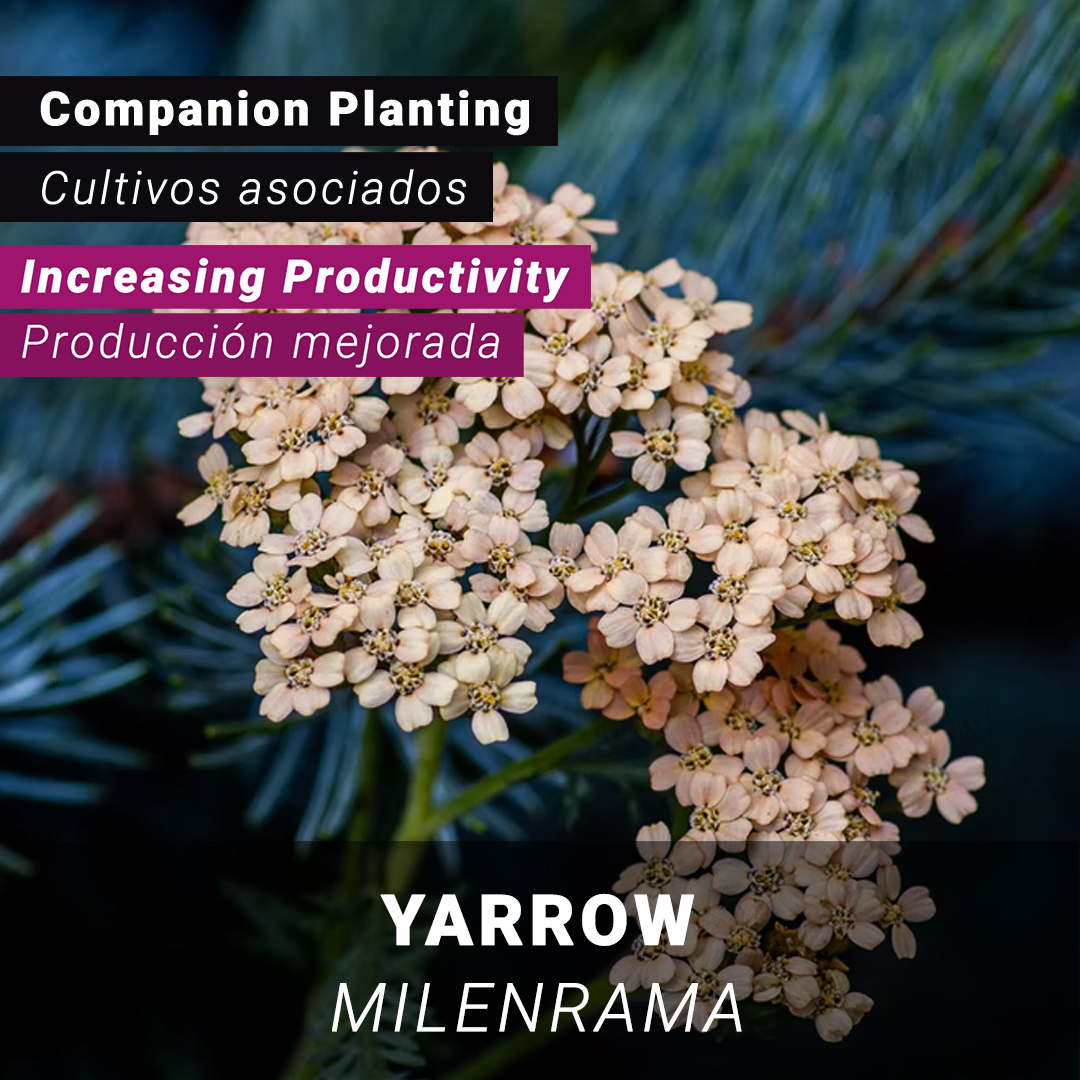
We also posted some tips for pro growers like companion planting (any other plant combined that benefits your crop). This post meant to be very visual as the target was way more open to powerful images than text.
Infographics for energy saving (which was one of the strategies as TodogrowLED technology was an improvement in saving money for those growers with older lights) were a must in the feed.
